On this page
Use Scroll Depth Enhanced to investigate how far visits reached down a web page. Inspect a particular depth, choose whether to include all visits or only those with recorded scroll measurements, and export the map for discussion with your team.
Scroll reach helps you investigate where important content sits on a page. It does not show whether someone read the content or noticed a particular element.
This guide applies to website projects, including website visits on mobile devices. Native app projects use Scroll Activity, which describes recorded gesture distance rather than the same page-reach map.
Open the scroll depth map
- Select your website project and open Heatmaps.
- Open the page or group of pages you want to analyse.
- Check the date range and device selection. Choose a recorded page preview that represents the layout you want to inspect.
- Select Scroll Depth in the side panel.
- Check Include all visits, which is on by default. Keep it on for the all-visits view, or turn it off to inspect the distribution among measured visits.
The coloured overlay shows recorded reach across the page preview. Use its legend to interpret the colours. Scroll-depth data loads independently of click-interaction data, so you do not need to wait for all click data to finish loading before starting this analysis.
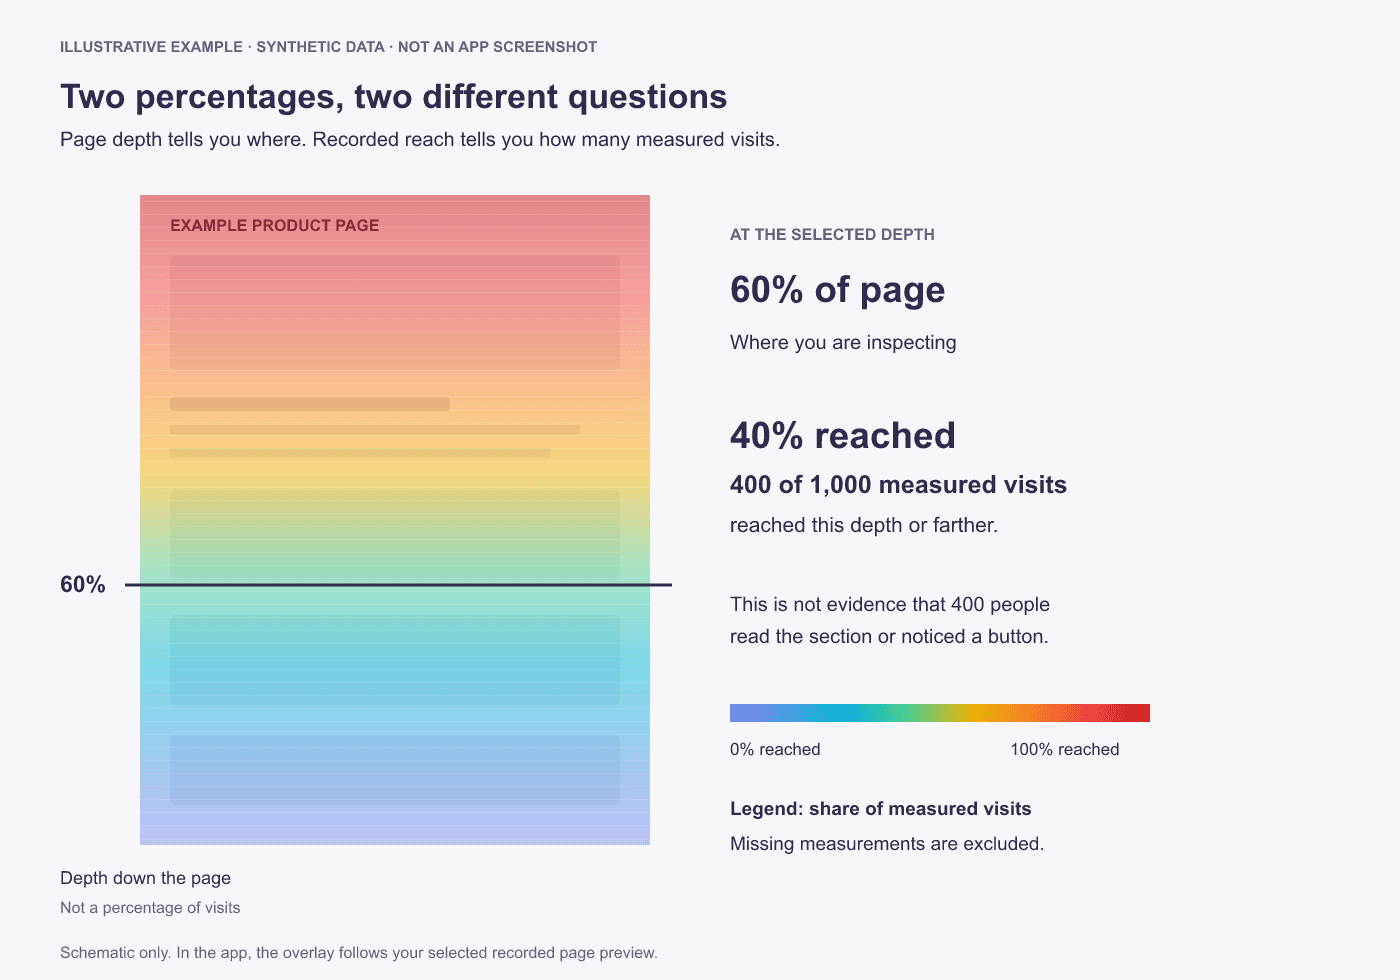
Measured-visits example with Include all visits turned off. Synthetic data, not an application screenshot; the page layout is schematic.
Choose what the percentages describe
Include all visits changes the population used by the map. “All visits” means visits in the selected page or group, date range and device scope, not every visit in your project.
| Setting | What the map describes |
|---|---|
| On, the default | Reach relative to all visits in the selected scope. When available, it also includes an estimate of the first-screen area for visits without recorded scrolling. |
| Off | Recorded scroll reach relative to visits with a valid scroll-reach measurement. Visits without that measurement are excluded from this distribution. |
The coverage line, such as Scroll measured in 1,000 of 1,200 visits (83.3%), helps you see how much of the selected population has a recorded scroll measurement. This is measurement coverage, not the share that reached a particular depth.
Understand the all-visits view
A visit can include the first screen without any scrolling. Where a saved viewport height is available for a visit without recorded scrolling, the all-visits view estimates its initial reach relative to the height of the selected page preview.
This contribution describes an estimated first-screen area, not an observed scroll or proof that the person read that area. It depends on the selected preview: a different page height can change how the same viewport height maps to percentage depth.
Check the wording in the readout:
- Estimated reach includes the first-screen estimate alongside recorded scroll reach.
- Confirmed reach reports the recorded reach count against all visits when that estimate is unavailable. A missing measurement remains unknown; it is not proof that the visit did not reach the depth.
- Estimating first-screen reach… means that the additional estimate is still loading. Allow it to finish before interpreting the final map.
The top of an all-visits map is shown as 100% by convention. This does not establish that a specific element was visible or read in every visit.
For example, if 400 measured visits reached a depth and the selected scope contains 1,200 visits, confirmed reach is 400 / 1,200 = 33.3%. With the setting off, the same 400 visits out of 1,000 measured visits give 40%. If available first-screen estimates also reach that depth, they contribute to the all-visits numerator and the readout is labelled estimated reach.
Read the measured-visits view
Turn Include all visits off to reproduce the examples in the two illustrations. In this mode, the readout contains two different percentages:
| Value | What it means |
|---|---|
| 60% of page | The depth you are inspecting, measured down the page. |
| 40% reached | The share of measured visits whose recorded reach extended to at least that depth. |
| 400 of 1,000 measured visits | The visit count behind that share. |
These numbers are a fictional example, not a customer result. At 60% of the page, 400 of the 1,000 measured visits reached that depth or farther. It does not mean that 40% of all visits read the section shown there.
With Include all visits off, the map uses visits with a valid recorded reach measurement. Visits without that measurement are excluded. Missing measurement is not evidence that someone failed to reach a section.
The No Recorded Scroll and With Scroll summaries describe all visits in their stated scope. Their percentages answer a different question from the reach map, so do not use them interchangeably with the map's measured-visit percentages.
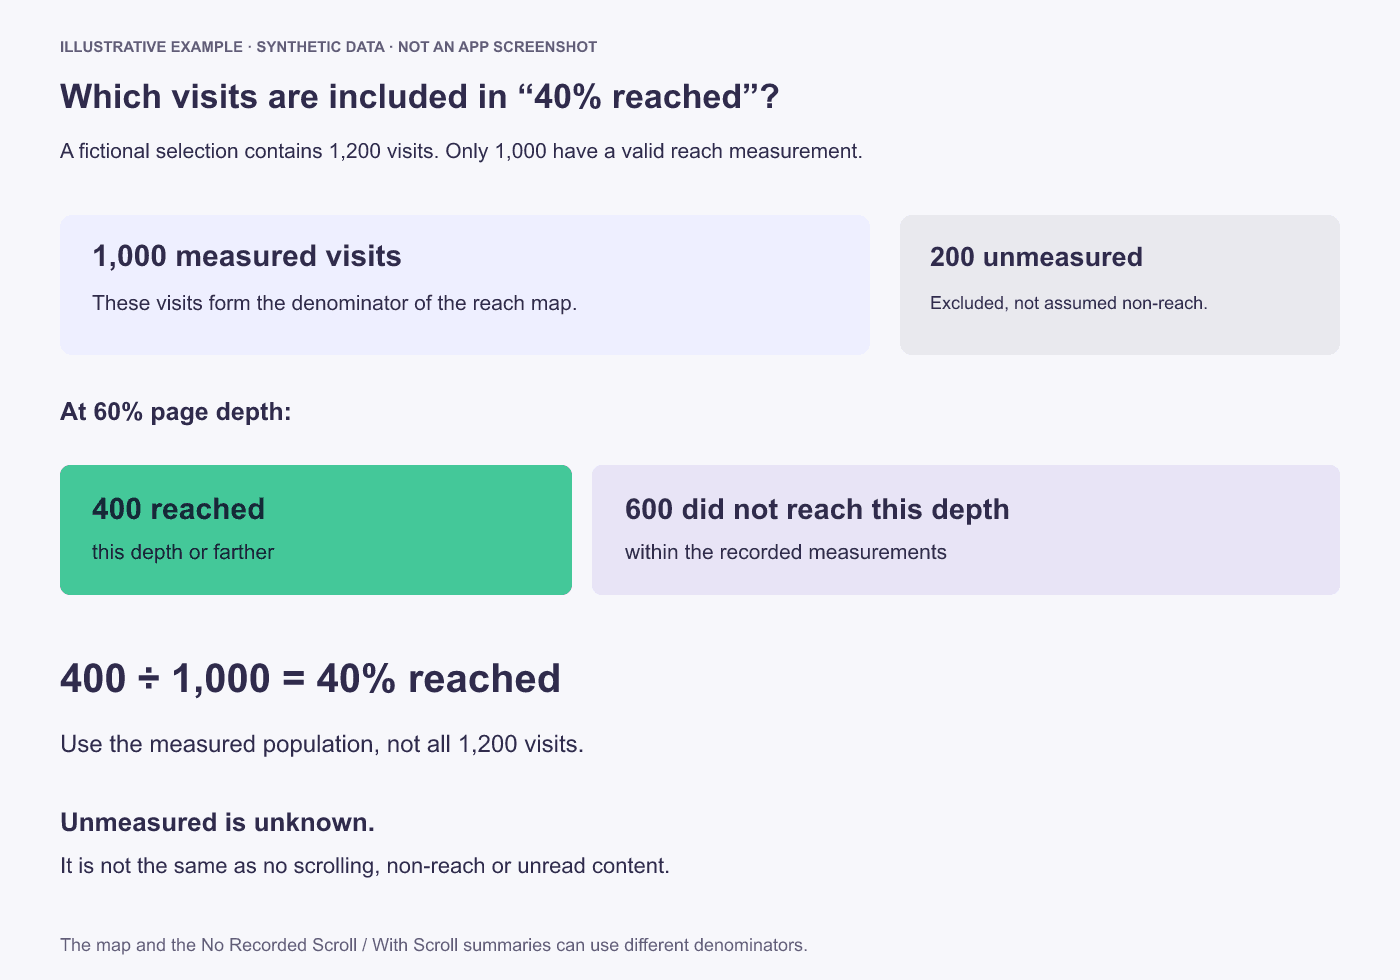
Measured-visits mode only: 400 divided by 1,000 measured visits gives 40%. The 200 visits without measurements are excluded from this calculation. Turning Include all visits on changes the denominator to 1,200 and may add available first-screen estimates.
Inspect a particular part of the page
Use Inspect page depth to select a depth in 1% steps. The preview moves to the selected position and shows an inspection marker. You can also use the slider with the keyboard.
If you scroll the preview manually, the inspector updates to match the position around the centre of the visible area. Move the pointer over the map, or touch it, for a readout at another depth. Adjust Overlay opacity when you need to see the page content more clearly.
The address retains the selected inspection depth. Copy it to return to that point or send it to a teammate who has access to the project. Copying the address does not grant access to the data.
Interpret the map in context
Start with a specific question, such as whether recorded visits reached the depth where a delivery-information section appears.
Check the layout in the selected preview before interpreting the result. Different devices, page variants and grouped URLs can place content at different depths. A shared percentage does not prove that the same element appeared there in every visit.
Use the map to form a hypothesis, then inspect relevant visit recordings to understand the behaviour. A lower share farther down the page alone does not explain why people stopped, whether they found what they needed earlier, or what affected conversion.
Compare reach with the other scroll values
The overlay describes reach at a percentage of page depth using the selected mode. With all visits included, this can combine recorded scrolling with estimated first-screen reach. Pixel and screen-height values describe scroll distance.
The percentile markers and table provide additional distribution context. Read their labels and units before comparing values. A distance of two screen heights is not the same as reaching 50% of a page, because page and viewport sizes vary.
Export the map
With Scroll Depth selected, choose Export when the action is available. The export reflects the selected Include all visits mode and includes the scroll reach overlay, colour legend, measurement coverage and the applicable confirmed/estimated or measured-visits explanation for the selected preview.
The temporary pointer readout and inspection marker are not included. Keep the date range, device and page selection with your notes so teammates can interpret the image in context.
If the map is unavailable
A full overlay requires suitable recorded reach data or, in the all-visits view, available first-screen estimates. If neither is available, do not interpret the missing overlay as 0% reach. Check the project, page selection, date range and device. Older data or unavailable measurements can leave you with scroll statistics or depth lines without a full reach overlay.
If first-screen geometry is unavailable, the all-visits view may still show confirmed recorded reach. This is different from the measured-visits distribution; check the readout before comparing percentages.
If Could not load scroll depth appears, select Try again. Some percentage data may remain usable even when pixel or screen-height values are unavailable; missing distance values do not automatically invalidate the reach percentages.
If the issue continues, open Help and support > Contact Support in the app. Include the project name, page or group, date range, device selection and error message. Do not include passwords, project tokens or unredacted customer data.