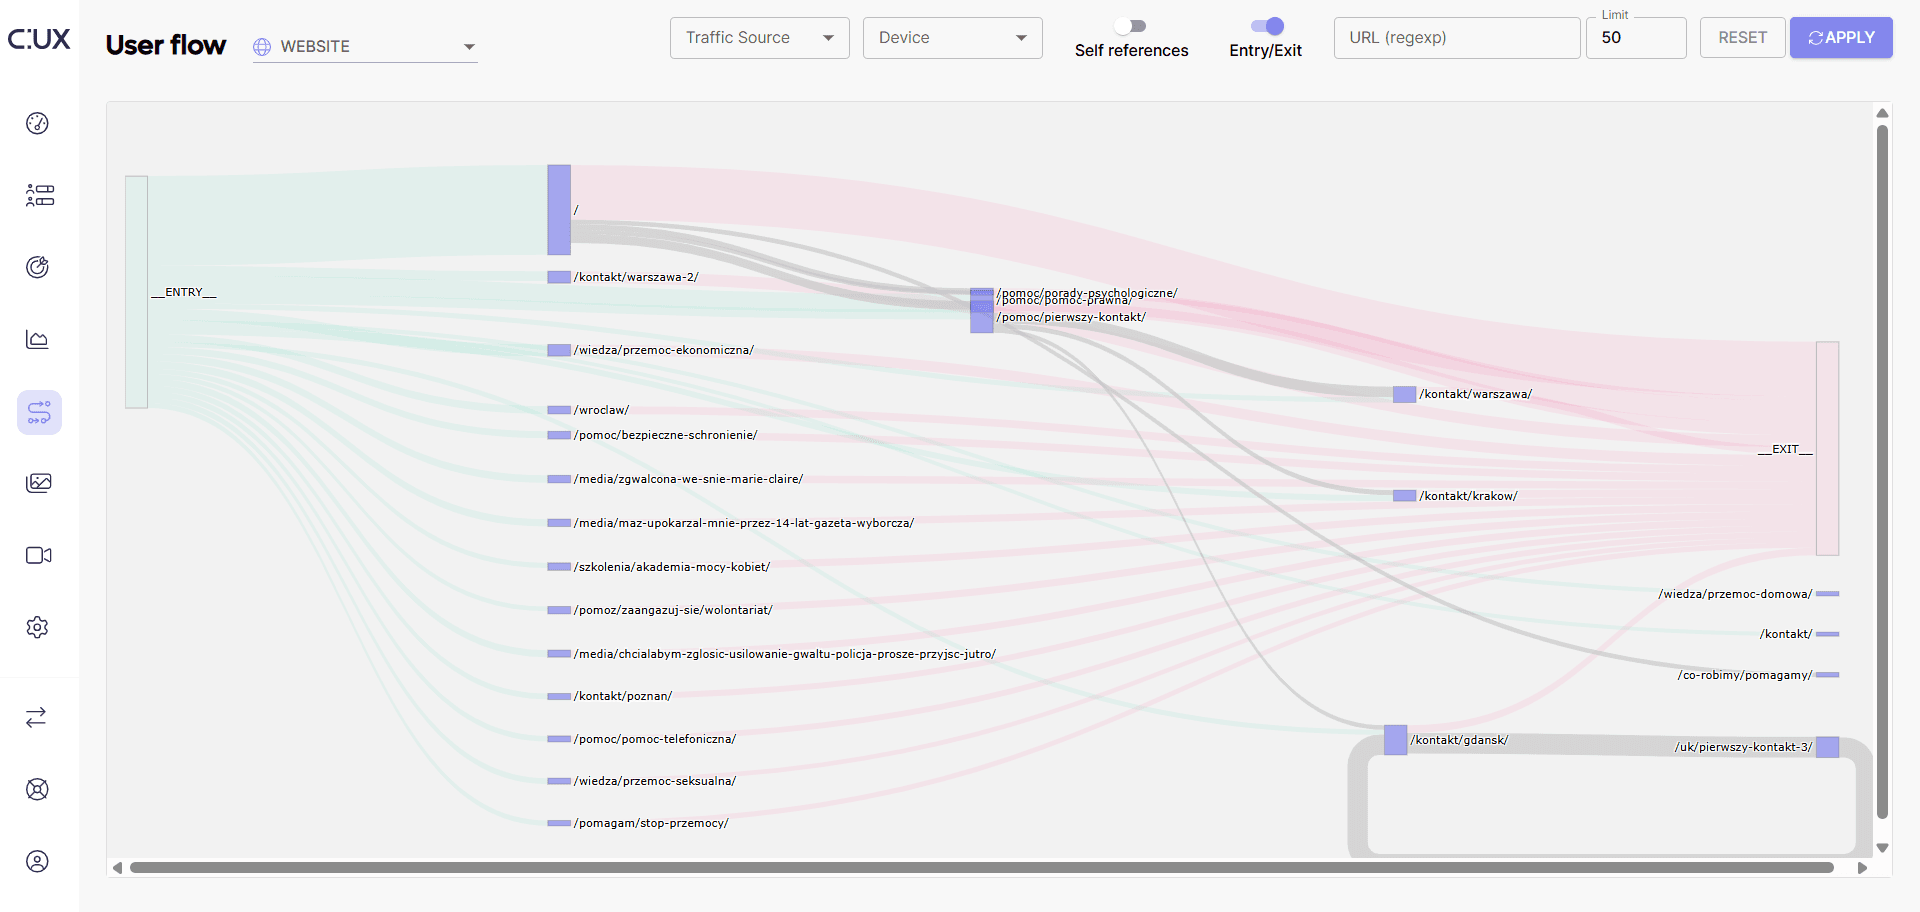
User Flow is built around two main elements: the filter panel and a chart.
The chart itself is a dynamic Sankey diagram that visualizes how users move across your website, using Nodes and Links as its building blocks:
- Nodes represent entry points, exit points, or specific web pages through which the flow passes.
- Links (also referred to as edges or flows) are the connections between nodes. They show the direction and strength of user movement. Hovering over a link reveals the exact number of recorded connections along that path.
By default, User Flow displays up to 50 of the most frequent flows within your project, together with the most common entry and exit points. This gives you a balanced overview of user journeys without overwhelming the chart with too much data at once: