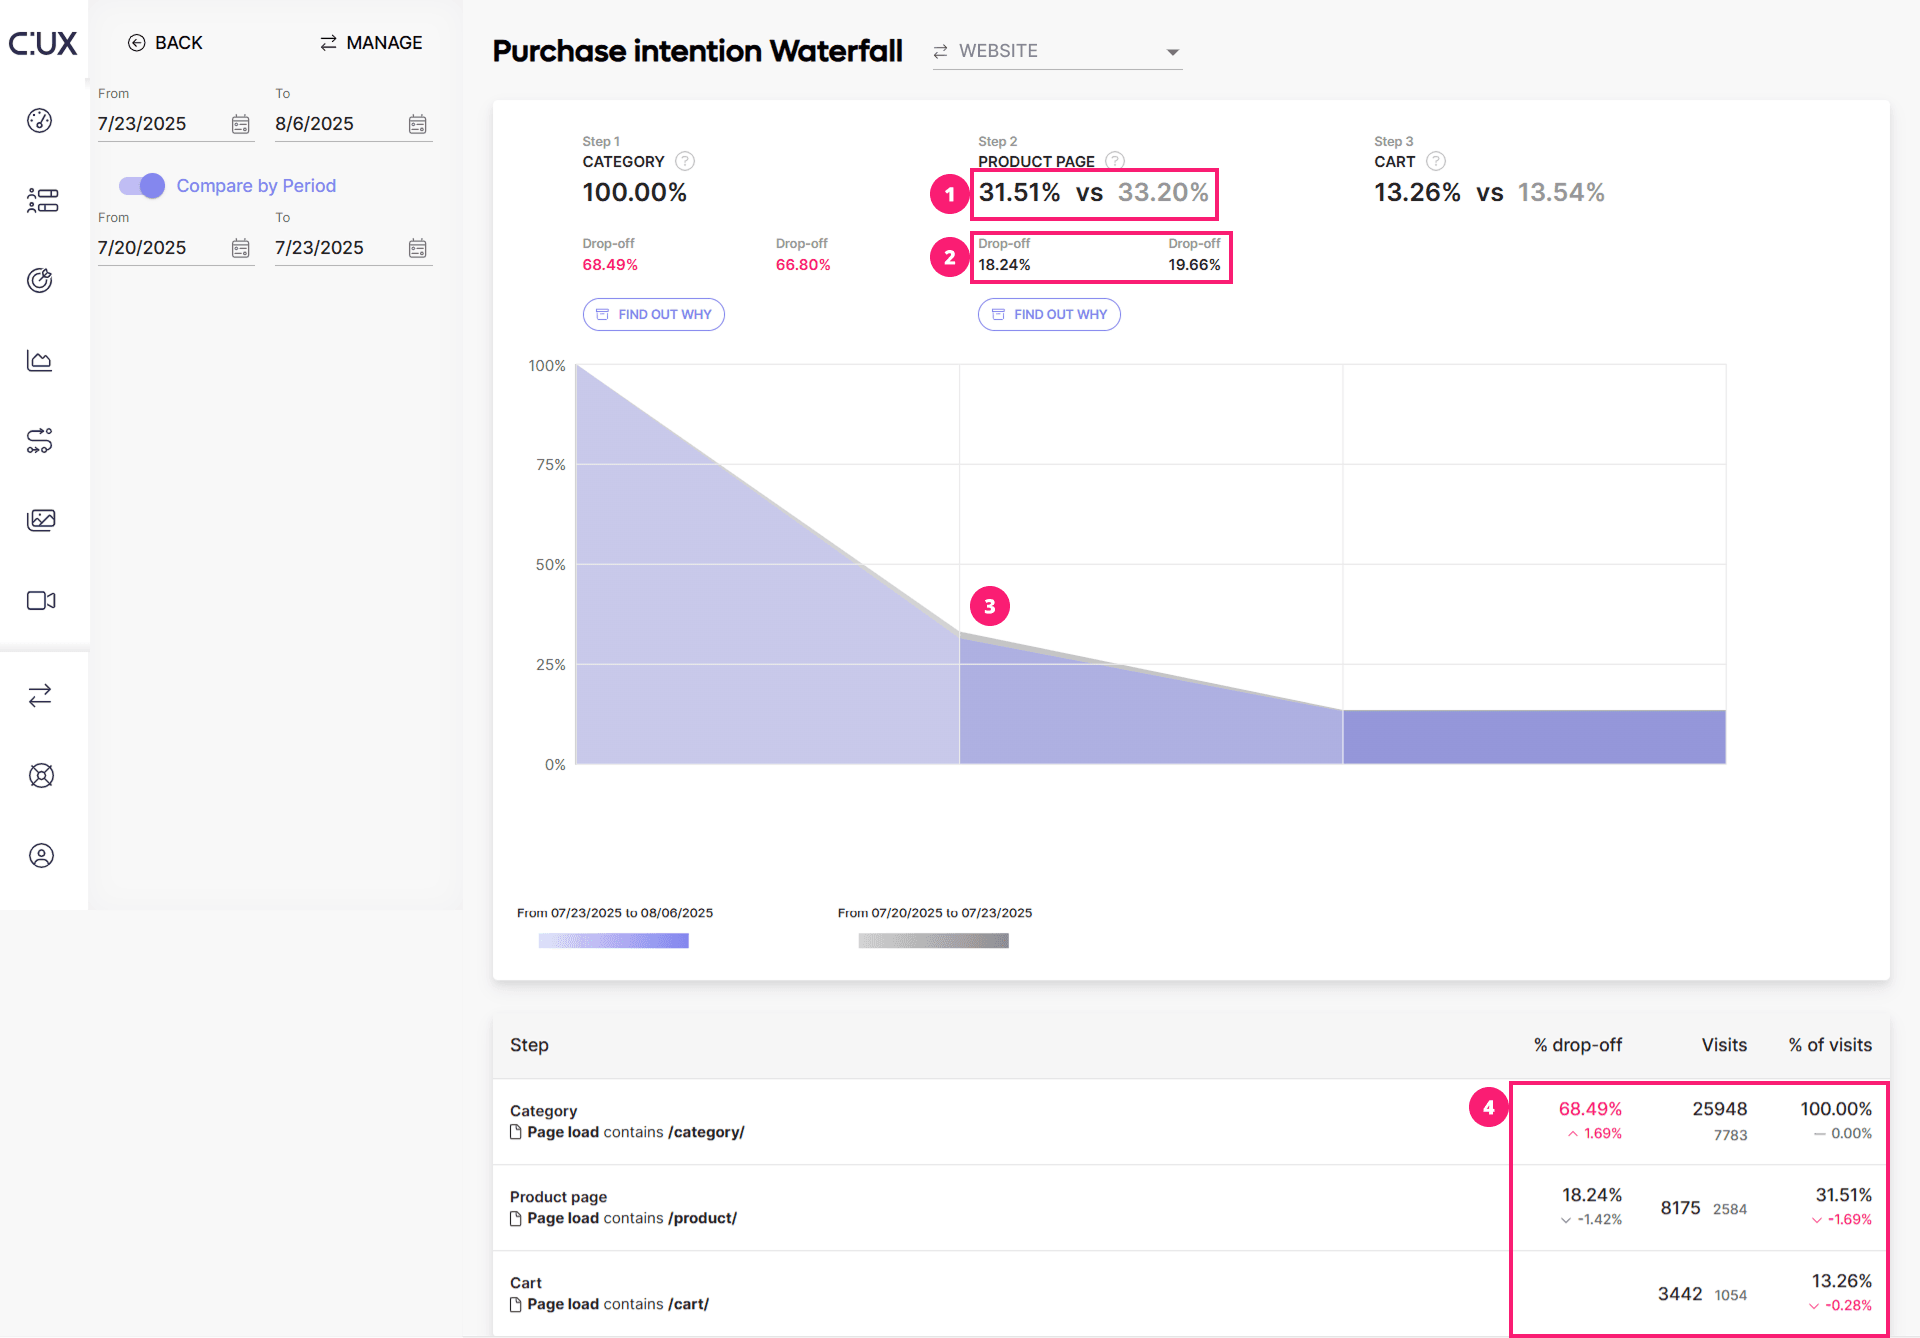
To view changes in Waterfall performance over time, click the 'Compare by Period' toggle under the date picker. By default, CUX will select a date range of the same length prior to the original one, but you can choose any data range within your retention period for comparison. Differences in the compared period will be visualized in the following areas:
- Step completion. The first percentage value (black) represents the originally selected date range, and the second one (gray) represents the compared period.
- Drop-offs. Comparison of how many visits ended on the selected step in the current and compared date ranges.
- Funnel chart. The difference between the original and compared date ranges is visualized on a chart. Below, you can find the chart legend with colors corresponding to the selected comparison periods.
- Table view. Here you can see the increase or decrease in % value of step completions or drop-offs.