See what’s new
We gave the CUX app a fresh new look. Experience metrics widget got an upgrade: You can now click ‘View More’ to open a full list of all pages where the selected pattern occurred, complete with device type and event counts.
Check details in the video
Experience Metrics in CUX provide you with all of the most relevant data regarding your visitors' overall experience on your website. CUX's algorithm detects user behavior patterns that may indicate technical or usability issues (points of frustration) on your website and presents them in the form of various Experience Metrics. These metrics are designed to help you identify pages and areas that could potentially cause user frustrations and to understand the user behaviors that trigger them.
Where to find Experience Metrics Experience Metrics are the key to uncovering users’ frustrations, identifying the optimization opportunities, and improving conversions. That’s why you’ll find them in various places in CUX, such as:
- Dashboard
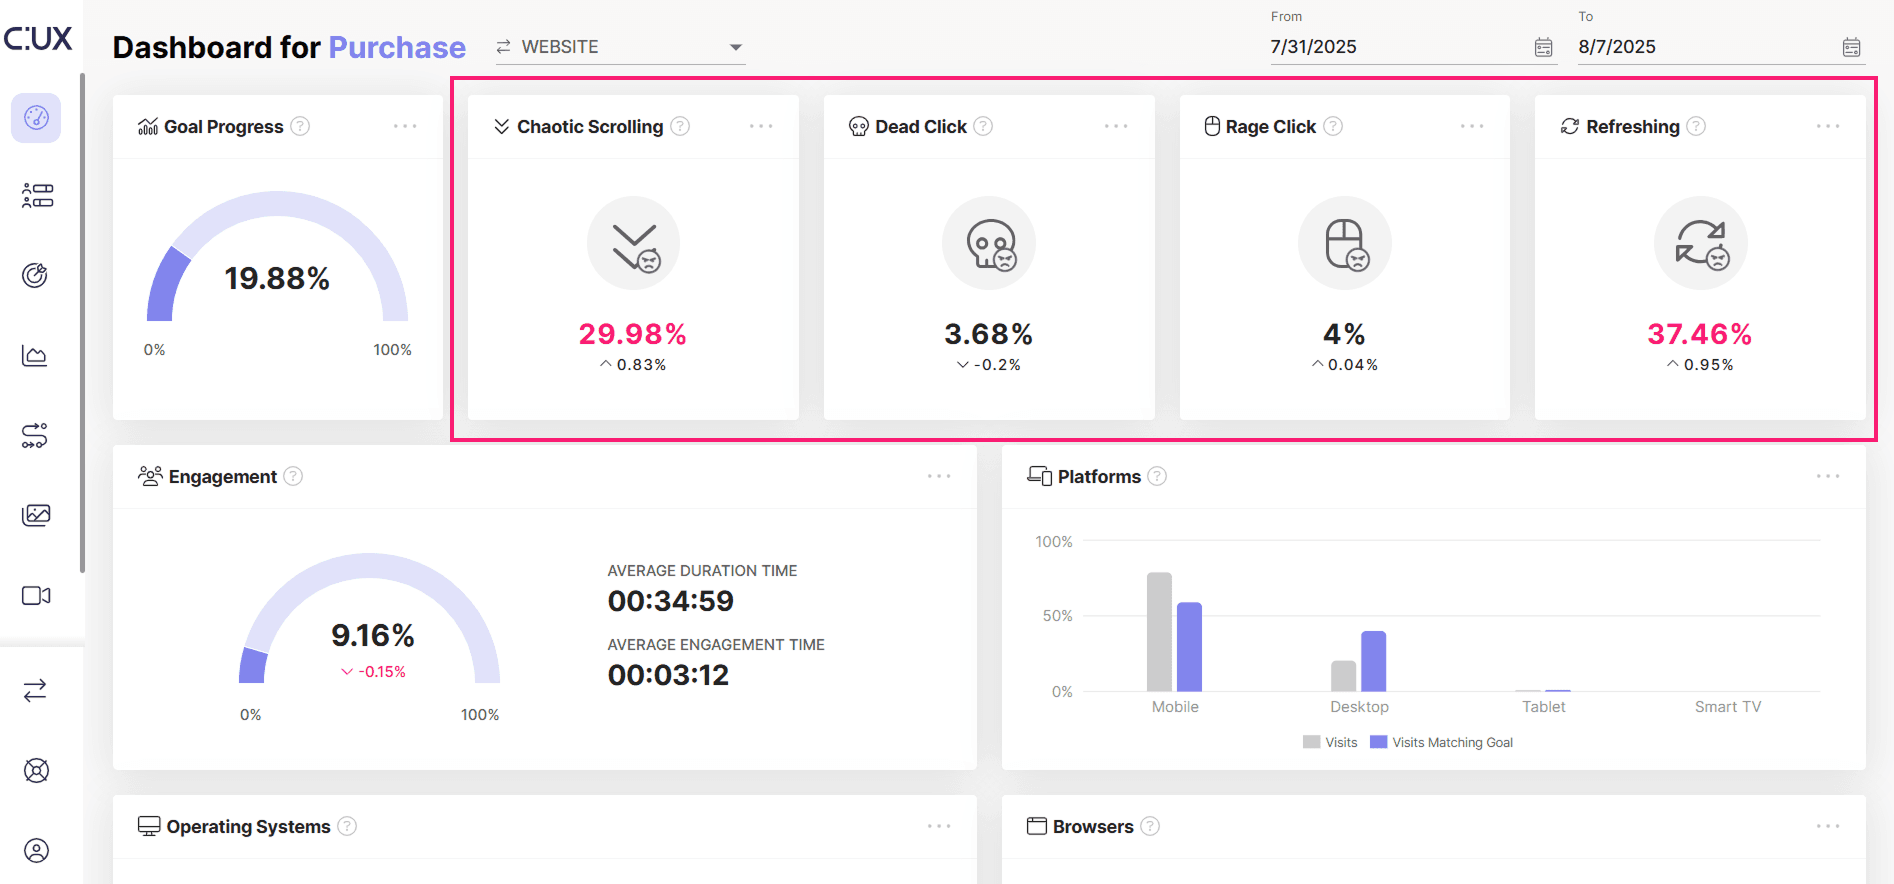
Here you will see only those Experience Metrics that are the most relevant for the goal you’ve selected to be shown on a Dashboard.
- Experience Metrics Tab
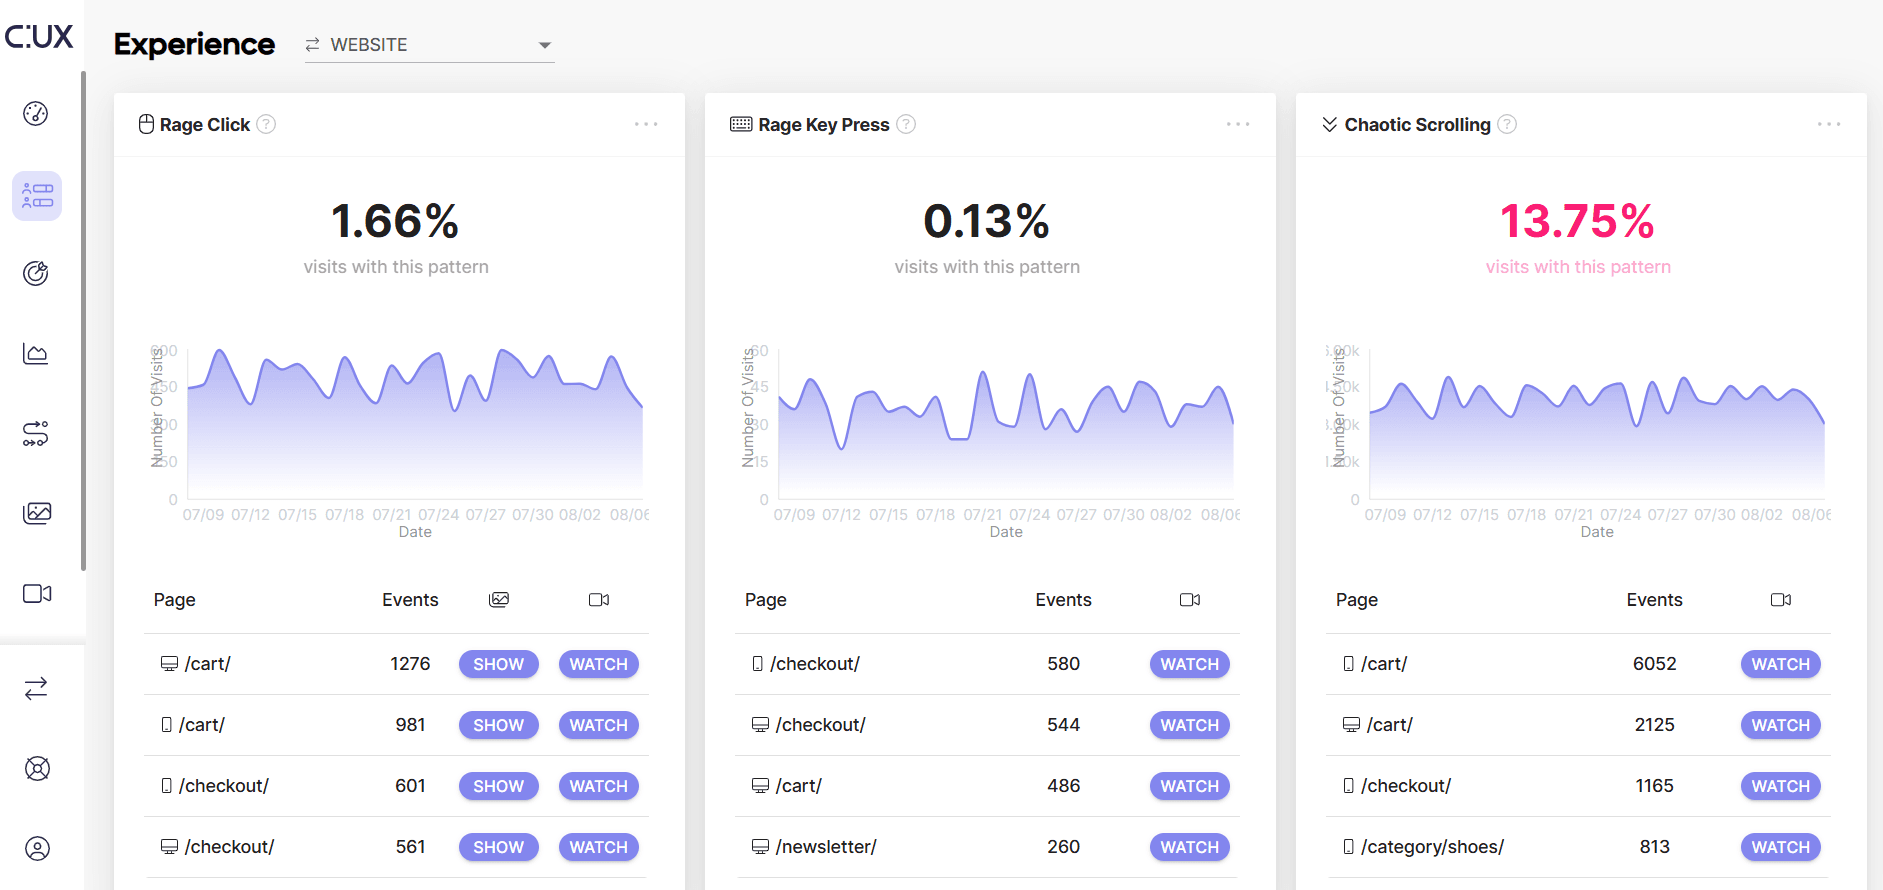
This page provides an overview of Experience Metrics based on your collected data. Each metric displays the percentage of visits with that pattern, its distribution over time, and offers a list of URLs where this pattern occurs most frequently. Each presented URL also gives information about the device, visit count, and links to recordings and heatmaps. Please note that heatmaps are only available for specific Experience metrics like Rage Clicks, Dead Clicks, and Zoom.
- Goals
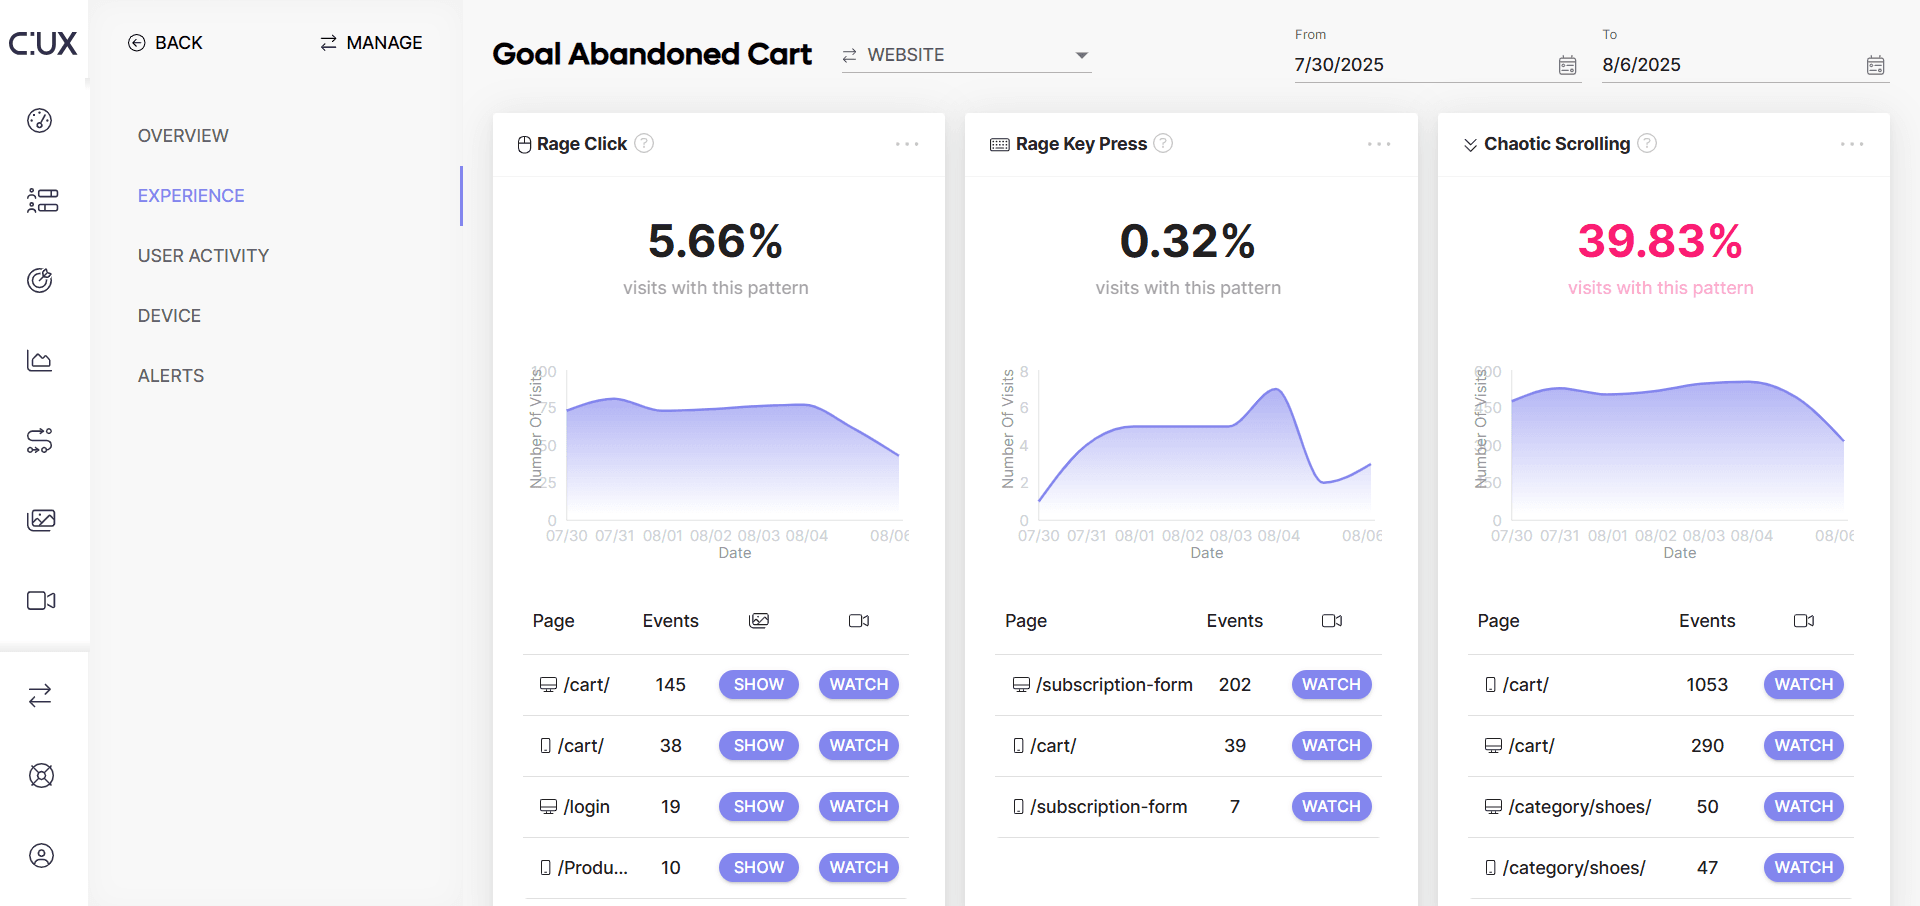
In the Goal section you'll discover all the most important information about visits that have met the goals, including Experience Metrics. You’ll find them in the Experience tab, where you'll see the same list of patterns as in the Experience Metrics tab. The data presented on widgets, however, is specifically based on visits within the selected Goal.
- Heatmaps
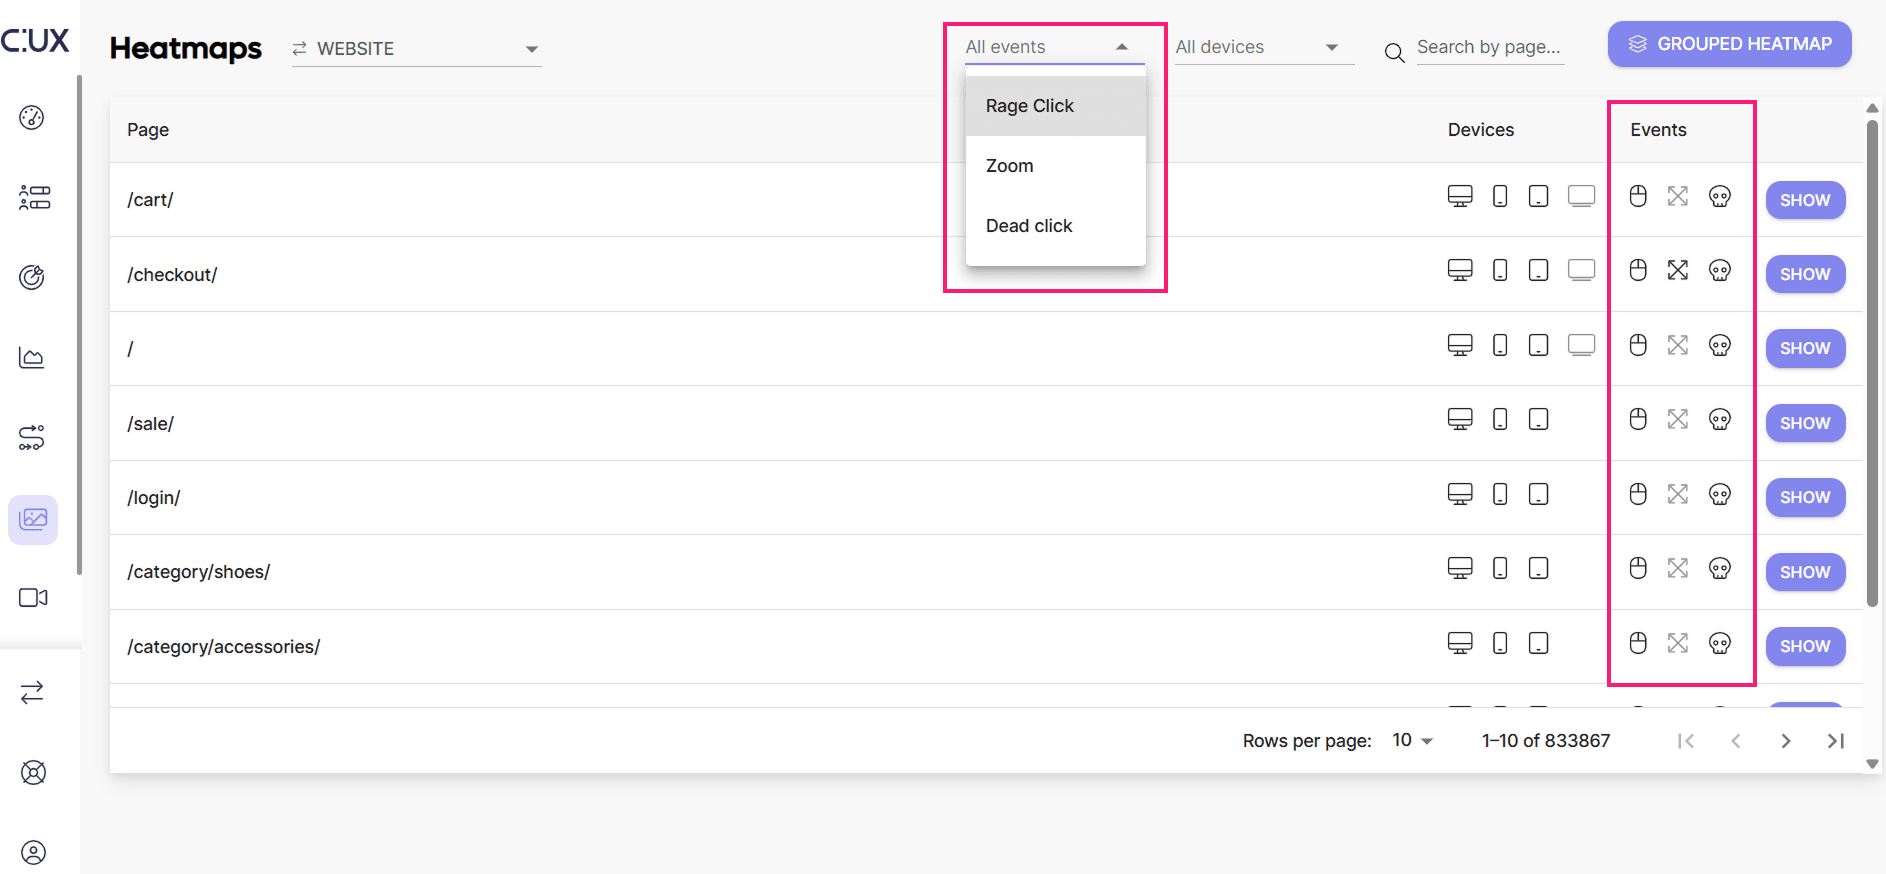
A heatmap displays the most significant actions of users on your pages in a graphical format. These actions are based on events such as clicks, link clicks, or mouse movements. In addition to these events, you will also find here some Experience Metrics, including Rage Clicks, Dead Clicks, and Zoom. It is important to note that a heatmap for any type of event can only be generated if there are a sufficient number of those actions. You can further filter heatmaps using Experience Metric filter on the Heatmaps page or navigate directly to the heatmap of a selected metric using dedicated icons in the Events column:
- Visit Recordings
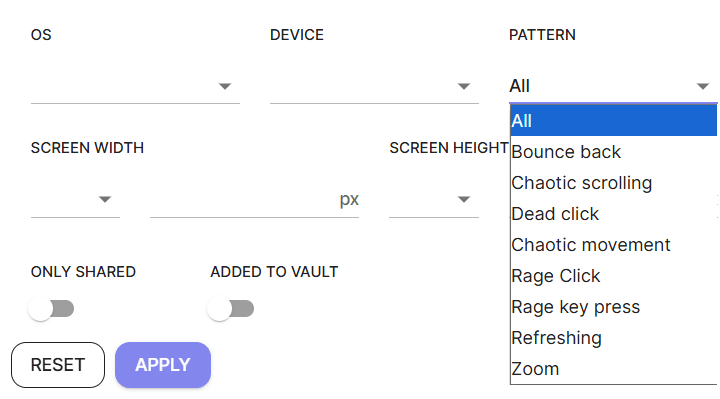
Visit recordings offer a more detailed view of individual user sessions on a website. They record and playback the entire user path, including all user interactions and Experience Metrics. When one of the Experience Metrics is detected, you’ll notice it marked as a pink indicator on the CUX player’s timeline. You can also filter recordings using the Experience Metrics filter. Tip: When you use the Experience Metrics filter in combination with an 'Any page' filter, CUX will filter for you recordings where the selected pattern occurs on the selected page.