Experience Metrics are a CUX feature that helps to recognize, detect and define the behavioral patterns of your users. These metrics often serve as indicators of potential frustrations and negative user experience during their visit. CUX tracks various experience metrics, including:
- Zooming
- Rage Click
- Rage Key Press
- Refreshing
- Chaotic Movement
- Chaotic Scrolling
- Dead Clicks
- Bounce Back
The Experience Metrics on the dashboard are displayed through dynamic widgets. The number and the type of widgets displayed may vary based on the currently featured goal on the dashboard. We intentionally showcase patterns that are most relevant to visits that have successfully accomplished the selected goal, allowing you to focus only on the essential data. Each widget shows how the presented experience metric has changed compared to the period preceding the selected one.This helps you monitor potential increases in user frustration or decreases in usability.
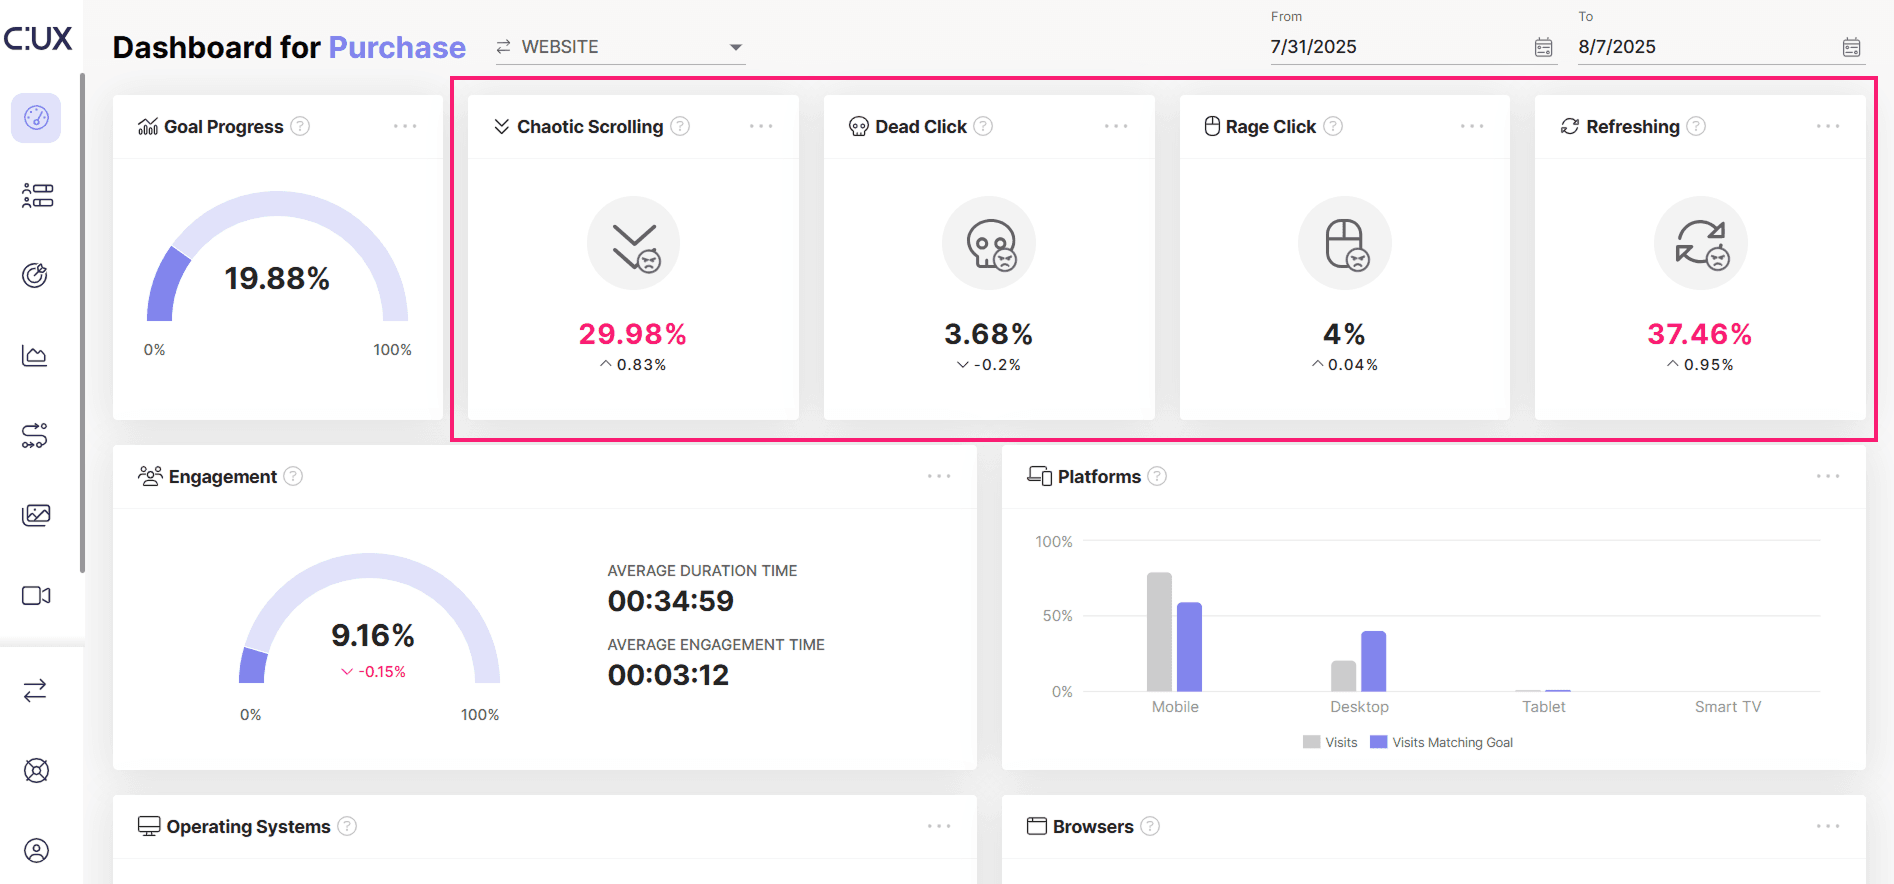
Discover the meaning behind each Experience Metric in our dedicated article on Experience Metrics.