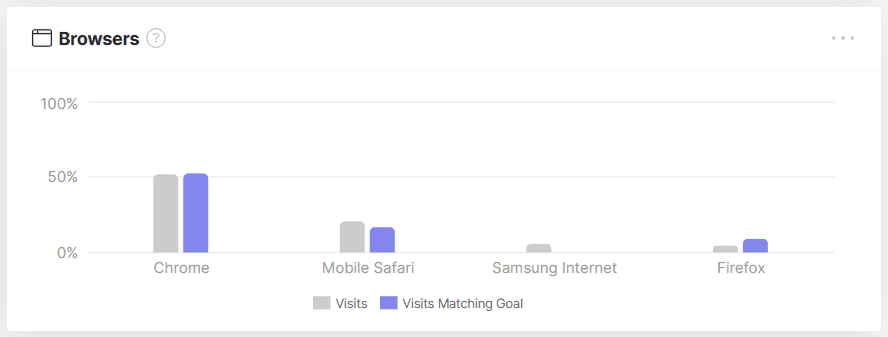
The Browsers widget reveals the browsers used by your visitors to access your page and the proportion of visits that completed the goal. Grey columns depict the overall traffic coming from the browser, while blue columns show the traffic from the specific browsers which completed the Goal.
Example
In this example, you can see 4 most popular browsers within the project. The proportion of browser segments are almost identical for all traffic and Goal visits. But you can notice that within the selected Goal there are almost no visits for a Samsung internet browser. The most popular reasons for this could be technical issues in some browsers, worse usability on certain devices or just your audience preferences.