After clicking on any goal you will land on the Goal Overview tab. Here you'll see all the most important metrics for visits that met the goal.
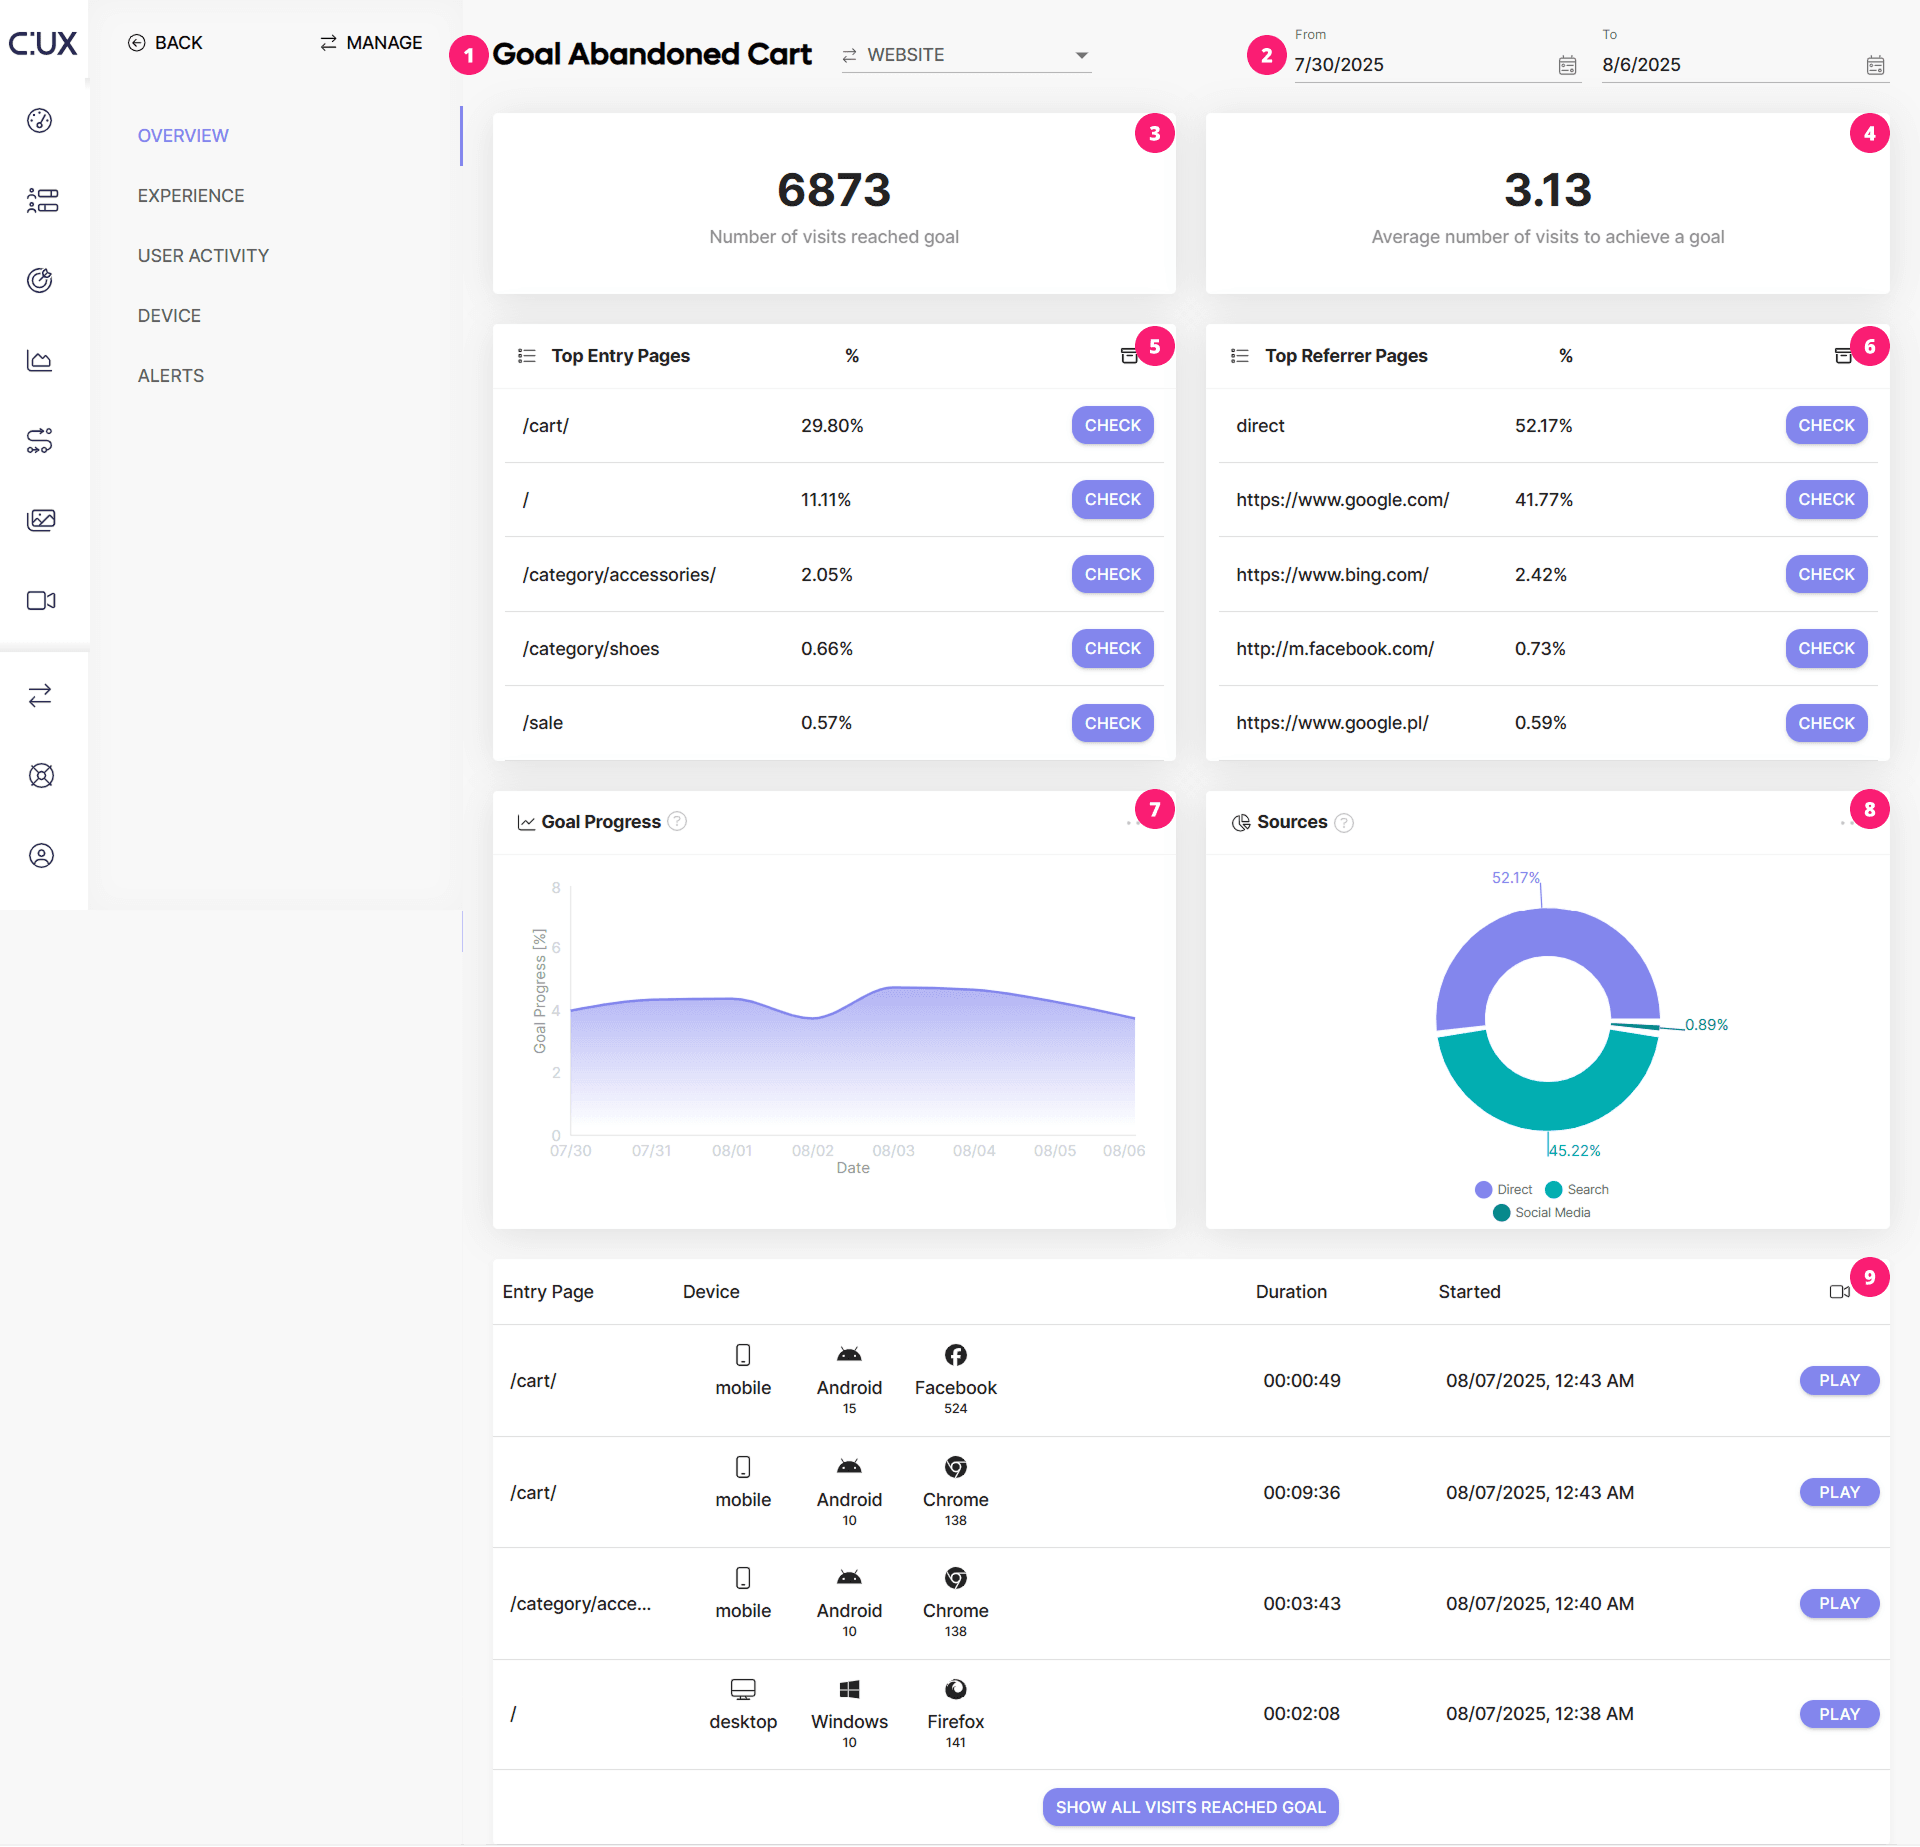
In the Overview Tab of your Goal, you'll see:
- Goal name
- Date picker. By default, the goal shows data from the last 7 days. However, you can choose any data range within your retention period. For your convenience, we've also included quick data range options for the last week, last 2 weeks, and last month
- Number of all visits that have reached the Goal in a given time period.
- Average number of visits to achieve the Goal. This is the average number of visits a user makes before successfully completing the tracked goal. A lower number means more visits are coming from new users. A higher number indicates that more returning users are completing the tracked action. Remember that this value varies based on the selected date range, so it may differ for shorter or longer periods. Example: Let's consider a scenario when you have three different visits that successfully completed a goal. In the first visit, the user visited your page only once. In a second visit, the user visited 3 times, and in the third visit, the user visited 5 times before completing the tracked goal. As a result, the 'Average number of visits to achieve the Goal' would be 3. This means that, on average, users visit the site 3 times before successfully performing the tracked goal action.
- List of Top Entry Pages. In technical terms, the Entry Page refers to the first page loaded during a visit. The Entry Page widget displays the top 5 exact page URLs from which users began their visits to your site. You can click the 'CHECK' button to view all visit recordings for a selected Entry Page.
- List of Top Referrer Pages. This widget shows top 5 referrers - the URLs from which the user was redirected to your website.
- Goal progress over time. Keep an eye on your day-by-day goal's progress with this widget. Simply hover over the graph to view the percentage of visits resulted in successfully completing your goal on specific days.
- Sources. This section provides a breakdown of all visits within the goal by a traffic source.
- A list of the most recent visit recordings that successfully reached the Goal with information about their Entry Page, Device, Browser, Operating System, Duration of the visit, and its start time. To access more recordings for this goal, click on the 'Show all visits reached goal' button under the recordings list.