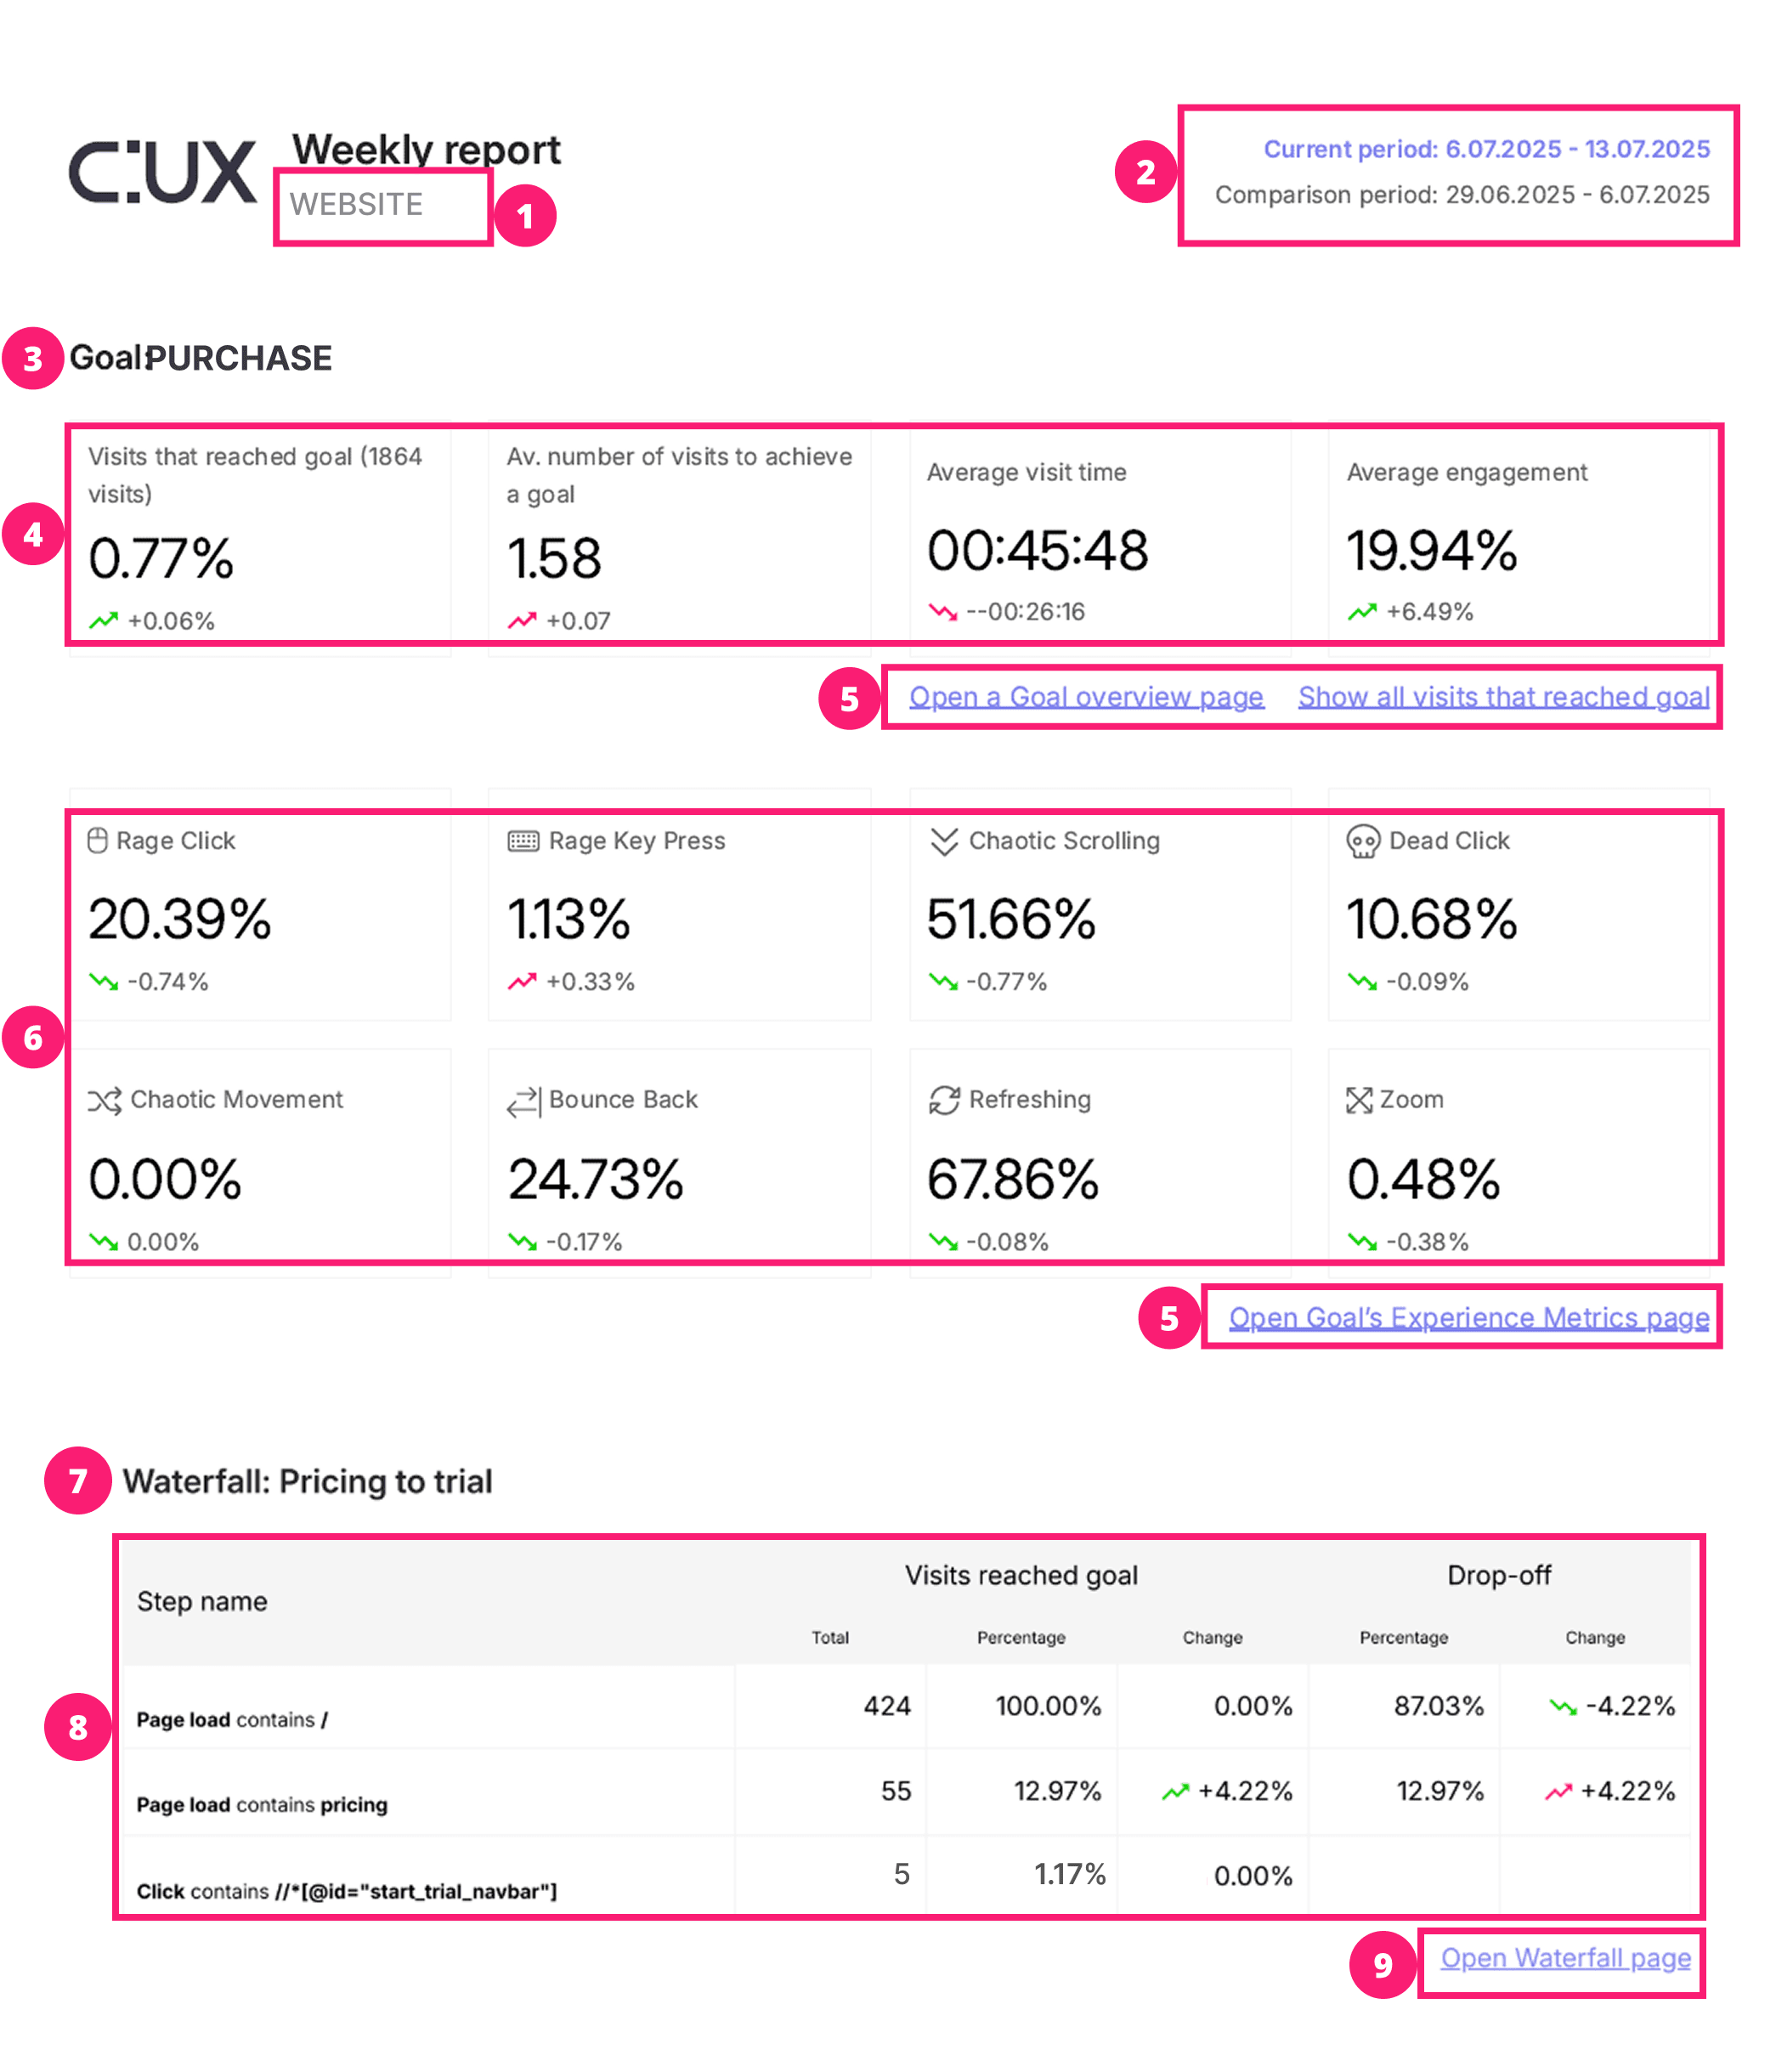
We’ve selected the most important metrics for the report that will allow you to read and interpret your Goals and Waterfalls, track the progress, see changes in data, and react to them appropriately.
The report will be sent to you every Monday as a PDF file. Here’s what you can find in a report’s file:
- Project name.
- Report data range. The report shows data for a week preceding the sending date - "Current period", and compares it with the prior week - “Comparison period".
- Goal. Name of the Goal added to a report.
- Goal’s metrics.
- Visits that reached the Goal
- Average number of visits to achieve the goal - the average number of visits a user makes before completing the selected goal
- Average visit time - time duration of the visits that achieved the goal
- Average engagement - the percentage of engagement time in relation to the average visit duration
- Links. Links to Goal pages and list of visits that reached the Goal.
- Goal’s Experience metrics. All Experience Metrics in the context of the selected Goal.
- Waterfall. Name of the Waterfall added to a report.
- Waterfall data. Waterfall data in the report is presented in a table view. Shows the number of visits on each step, its percentage and change, and each step's drop-off percentage and change.
- Link. Link to a selected waterfall.