In the Waterfall view, you'll find the most important information about your users' journeys.
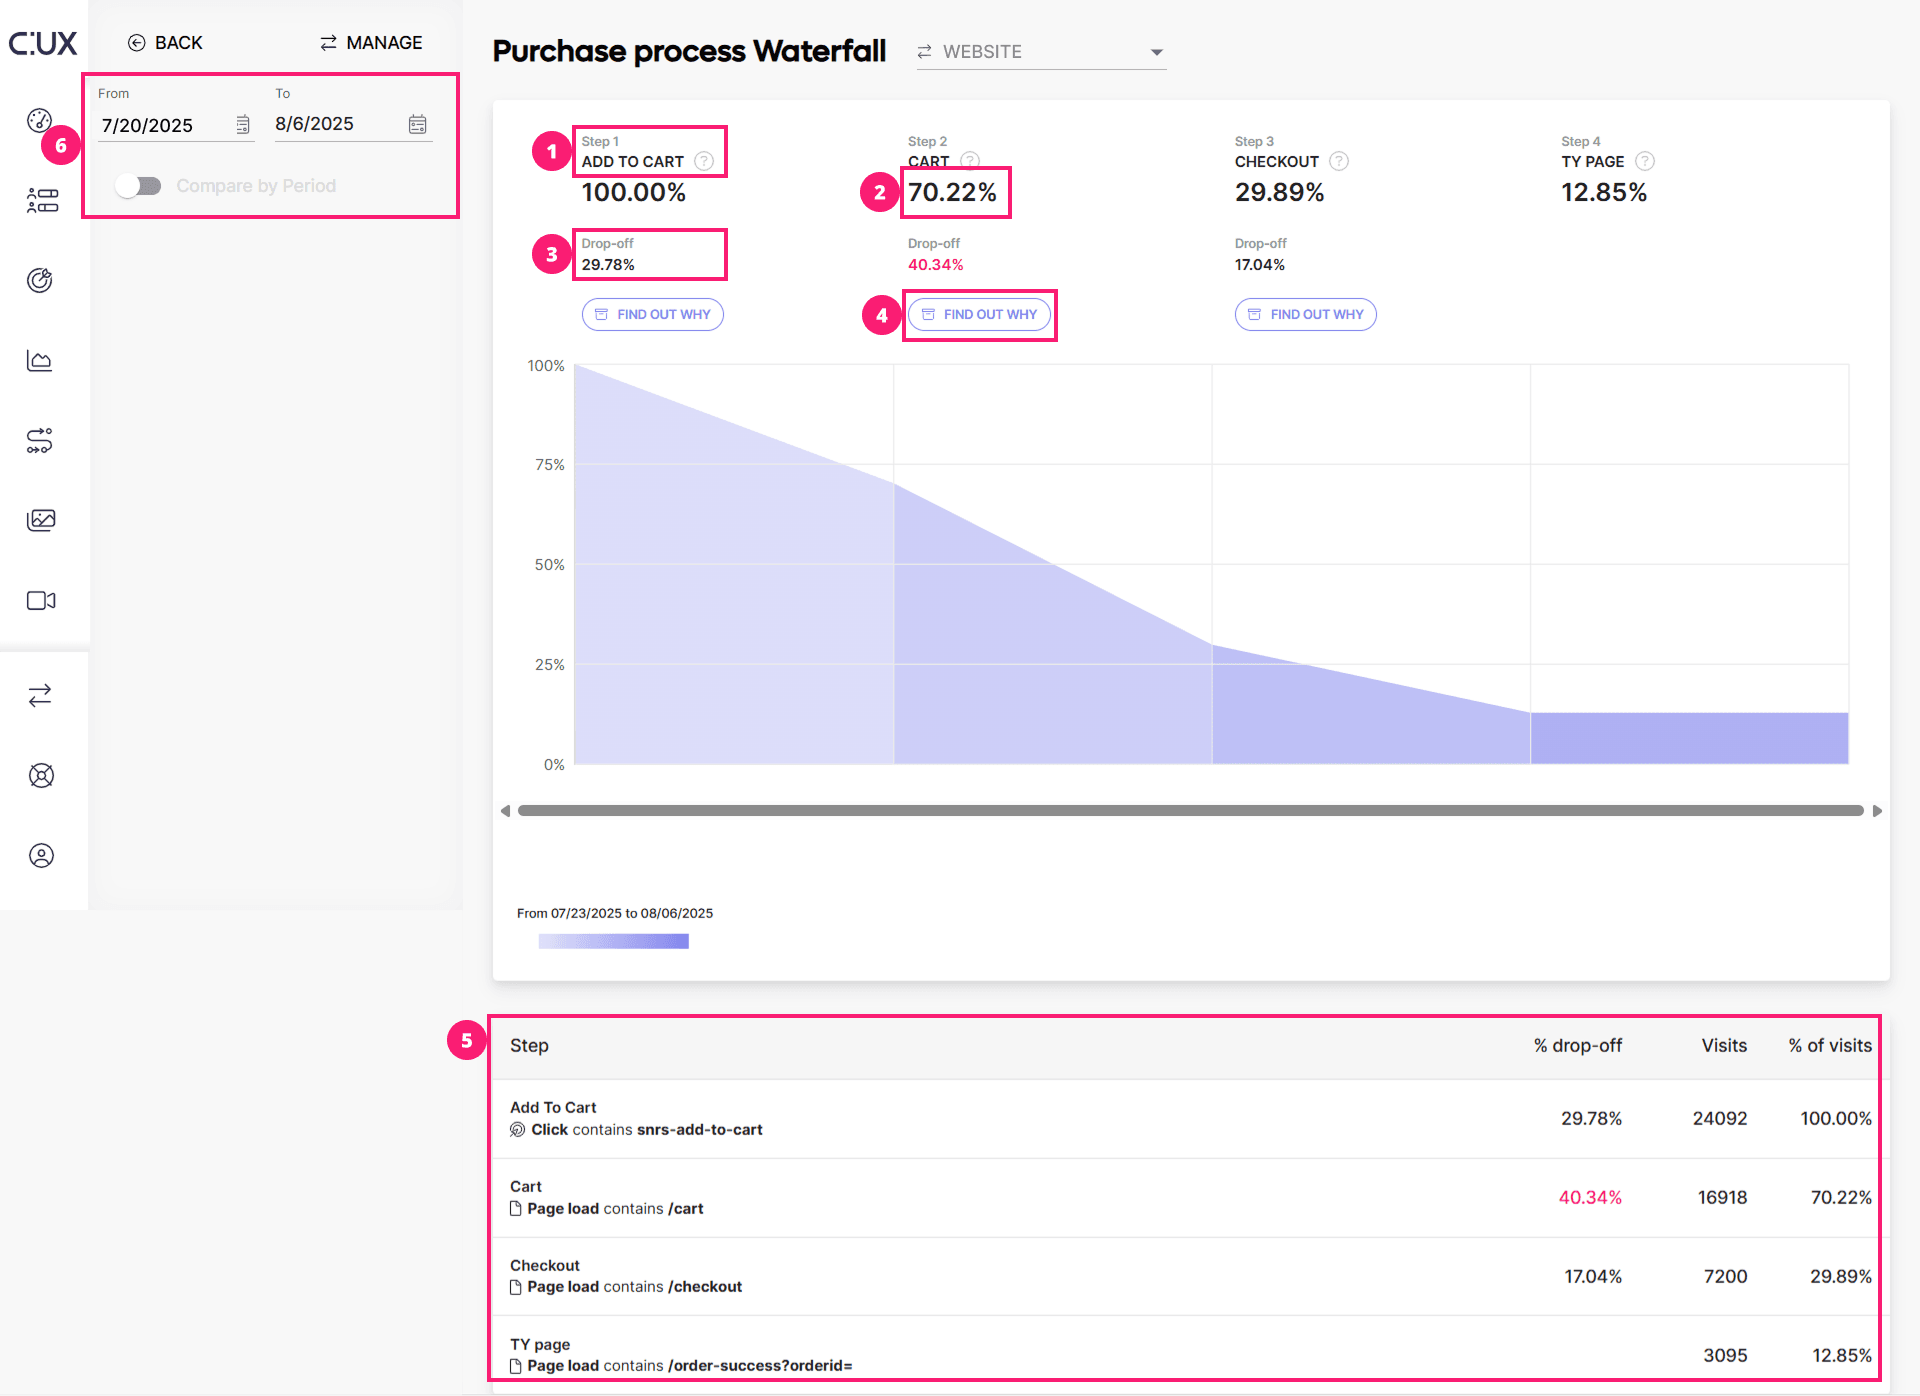
- Waterfall steps. At the top, you will see each of the steps in your Waterfall. Hover over the '?' icon to see the information about the number of visits that reached this step and the configuration details of the step.
- Step completion. It shows the percentage of visits that reached the step. Please note that this percentage value refers to the first step of the waterfall, which is taken as 100%, not for all visits.
- Drop-offs. This metric shows what percentage of visits have ended at this step of the waterfall. CUX will highlight in pink the significant drop-offs that require your attention.
- Visit recordings. For each drop in traffic, you can analyze a list of curated recordings to find the reasons behind drop-offs. Just click 'Find out why', and CUX will take you to the relevant recordings list.
- Table view. For your convenience, we also present the Waterfall data in the form of a table.
- Date picker and time periods comparison. By default in the Waterfall, you’ll see data for the last 14 days. However, you can choose any data range within your retention period using the data picker.