What is a Waterfall?
Waterfall in brief
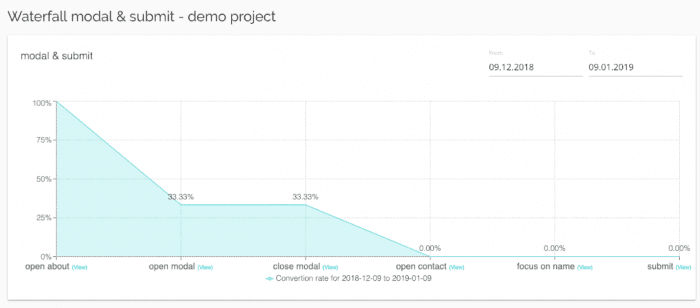
- A configured Waterfall is a line chart
- The Waterfall consists of steps
- The steps represent user actions on your site
- The order of the steps mirrors the sequence of actions people make to complete a task
- Waterfalls can represent any task, including a conversion funnel
- The Waterfall chart shows you how many people reach a specific step in a chain of events
- You can use events on the chart to access visit recordings for each of them
Waterfall in detail
CUX waterfall helps you track visitor behavior across various customer journey scenarios. In other words, the Waterfall is a graphical representation of any sequence of steps visitors perform on your site. You can visualize form submissions, account registration, check-out process, etc. You can also map a scenario to check whether visitors read terms and conditions when you ask them to. It’s up to you what you want to see.
You don’t have to build extra long Waterfalls. Sometimes, it’s even better to have several smaller ones to break down complex processes into digestible chunks. This is good when you’re not tracking a monetary conversion process. When you intend to mirror your conversion funnel, then, of course, make sure to include all steps in a single Waterfall.
You can think of your Waterfalls as a collection of thriller short stories. There’s the plot – a sequence of actions you have set up. There’s a detective – you, investigating user actions. And there’s a central character – the visitor of your site. Will the hero reach the goal? What happens on their way that they don’t do it? Are there any events or other evidence that can tell you why? Waterfall helps you answer those questions.
A Waterfall event represents each user’s action. The progression of events builds a story for you to follow. Visitor actions very often aren’t linear. Sometimes people may seem chaotic or unpredictable on your site. Waterfalls help you analyze what happens when people take (or don’t) a specific action. The numbers on the Waterfall chart show you how many people have reached a particular stage. For each of the steps, you can watch visit recordings – the diagram shows your entry points to a filtered Visits page. Your examination of those visits should tell you if the intended course of events is reflected in reality. If not, try to gather as many insights as possible to adjust the flow. The Waterfall will tell you if you have succeeded.