July 15, 2025
13 min read
CUX Insights: Understanding your product through data
In the world of digital products, it's crucial to understand and improve how users experience them. This article explores how data is the key to achieving this goal.

Daria Ushanova
Digital Experience Analyst in CUX

Why do we need to understand products through data at all?
Numbers are an integral part of our daily lives, serving as a universal language for understanding, quantifying, and communicating with the world around us. In other words, they're like the building blocks that shape our understanding and help structure the reality we are calibrating throughout our lives. Is 100 grams of candies a lot or not? If my plane is one hour delayed, will I be able to catch another flight? How many guests are we expecting at the party? What is the average salary in the industry?
All this extends seamlessly to the world of digital products. Web analysis started back in the early '90s and has become even more important and relevant with the rise of the Internet. So if you're reading this article - you're probably not a total stranger to web analysis as well. You may already understand that achieving success goals goes beyond merely tracking product sales or campaign conversion rates. To truly thrive, you must dive into data to see and understand your product from your customers' perspective.
Data serves as a reflection and measurement of people's real interactions with your product in the real world. Understanding digital products through data is crucial for creating user-friendly products that drive business success. Data insights reveal how users interact with websites and web apps, helping us decide what features to focus on, how to improve the user experience, and what content to show each person. It also guides us to decide on resource allocation, performance monitoring, and security measures. In other words, data empowers us to make good choices and stay competitive in the ever-changing digital world.
What are the types of data and what do we need them for?
Let’s start by exploring the types of data. While data could be categorized in various ways, when it comes to digital behavior analytics, I find the following classification particularly helpful:

Registered data
Registered data refers to quantitative information that users either provide explicitly or that is generated as a result of their actions on a digital platform. This data is typically structured and stored in databases, making it easy to analyze using mathematical and statistical techniques. Examples of registered data include:
- User profiles: information like age, gender, location, and preferences that users provide during registration or account setup.
- Transaction history: details of purchases, including item names, quantities, prices, and payment methods used.
- Engagement time: the amount of time that users spend actively interacting with a webpage or website during a single session.
- Conversion rates: the percentage of users who complete a desired action, such as making a purchase or signing up for a newsletter.
- Traffic sources: the specific origin or channel through which users come to a website.
Registered data provides a solid foundation for evaluating the overall performance of your product and is essential for detecting anomalies and identifying seasonality and trends.
Observed Data
Observed data is the qualitative information gathered by monitoring how user interact with a digital platform. This type of data provides insights into user behavior, preferences, distractions, and pain points, allowing for a deeper understanding of user experience. For example:
- Session recordings: video recordings of user sessions that capture mouse movements, clicks, and other interactions with elements on a website or app.
- Heatmaps: visual representations of user activity that highlight areas of high and low interaction on a webpage.
- User testing notes: observations and comments made by UX researchers while conducting user testing sessions.
Observed data plays a crucial role in uncovering reasons behind anomalies, identifying navigation paths, and pinpointing areas with potential for improvement. It can also shed light on user intentions and frustrations.
Voice of the Customer (VoC)
Voice of the Customer (VoC) refers to feedback and comments users provide about their experiences, preferences, and opinions regarding a product. It is also a type of qualitative data that is often unstructured and can be collected through various channels, such as:
- User surveys: Feedback gathered through surveys or feedback forms, providing subjective insights into user opinions and experiences.
- Customer reviews and ratings: Feedback left by customers on dedicated platforms, along with star ratings.
- Social media mentions: Comments, posts, and messages on social media platforms discussing a product or service.
- Customer support interactions: Conversations between customers and support agents, including chat logs, emails, or phone call transcripts.
- User-generated content: Content created by users, such as forum posts, blog comments, or user-submitted photos and videos.
Voice of the customer captures direct feedback from users, helping us to understand what they really want, what they like or dislike, and what problems they face.
Working with different data types for a holistic view of your product
Every type of data complements each other and, when combined, offer a complete view on a product. Relying on each data type separately will give you only one side of the picture. For instance, you might observe rising cart abandonment rate, but you don’t know what causes it, or you may notice rageclicks on a heatmap, but have no idea what's their impact a purchasing process. Similarly, a bug report form one person provides limited insight into whether it's an isolated issue or affects more users.
To truly understand your product, it's crucial to leverage all three types of data - but there are a few ways it can be done. In my work, I usually use these three approaches:
- Getting an overview of a product
- Distinguishing anomalies from the norm
- Building user flows and user personas
Now, let's explore how to achieve this analyzing data in CUX, either independently or alongside other data sources.
How to get a clear picture of your product's performance
A product overview provides a comprehensive understanding of a product or its key parts, including its features, functionality, and how users interact with it. Think of it as a snapshot of the product's performance and user engagement. To build a solid foundation for further analysis, it's important to identify the main characteristics of your website or app traffic. This will help you understand the scale of certain user actions or easily spot anomalies.
The key player in this process is (of course :)) qualitative registered data, which provides essential metrics and statistics. Engagement metrics, traffic sources, demographic data, device usage, and many more - all contribute to measuring and describing our product or its segments (for example - a segment of converting users or traffic from a specific campaign).
In CUX the best way to gather all basic stats about a product or its segment is by setting a Goal:
- A wide range of events will help to set a lot of segments based on user actions (clicks, page loads, form usage) or traffic sources.
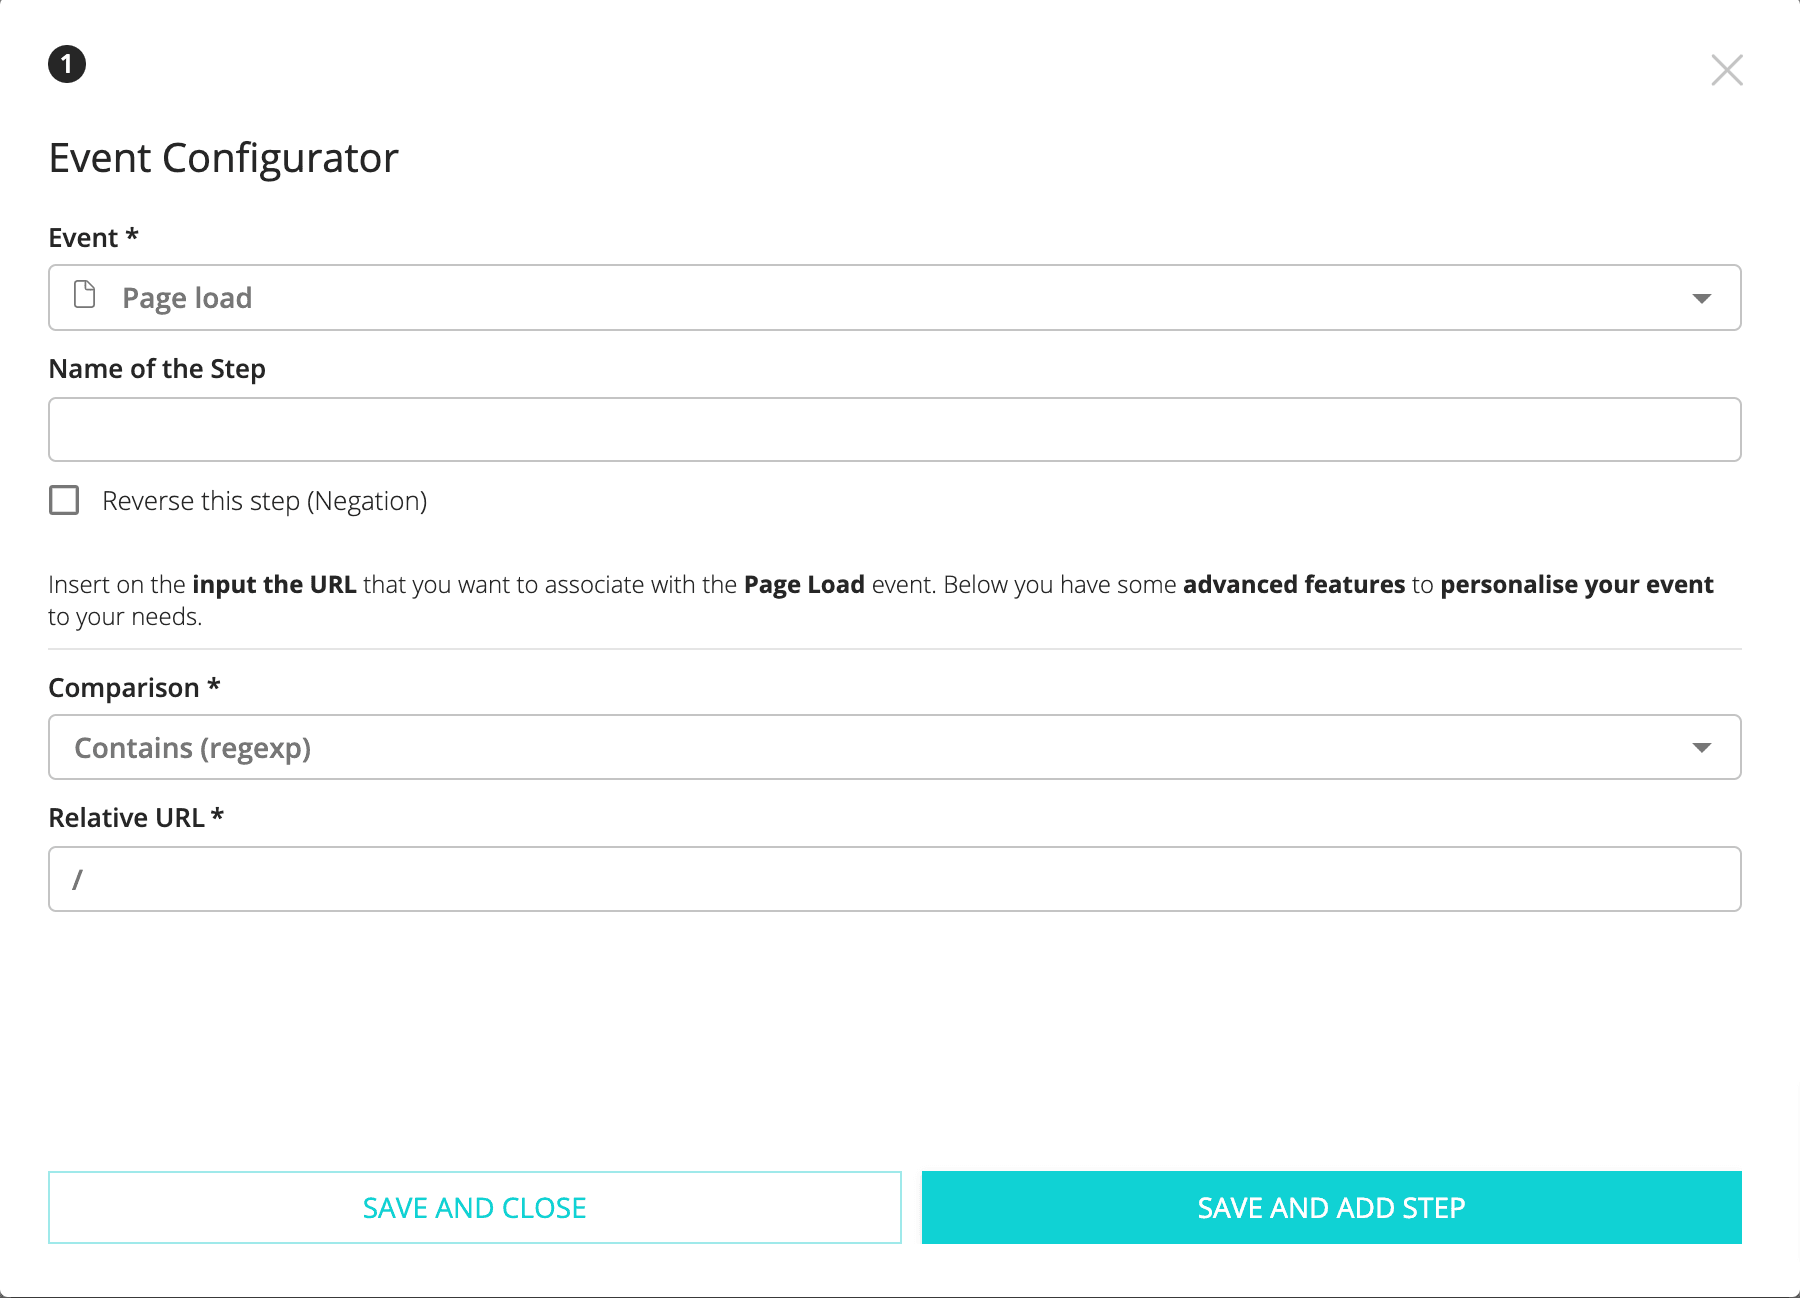
- If you want to get an overview of all collected visits simply create a goal with an event "Pageload", comparison type “Contains“ and "/" in a Relative URL field. Since every visit in CUX includes at least one page load, and every URL has "/" in it - this setting will capture 100% of the visits collected in CUX.
However, metrics aren't the only way to understand a product. Heatmaps offer an excellent way to dive into how large groups of users interact with a product. They provide a visual representation of user behavior data, highlighting areas of engagement and potential sources of frustration.
CUX offers several valuable features for gaining an overview of your products through heatmaps:
- A wide range of events: In CUX you’ll find numerous heatmaps types that allow you to explore and analyze user behavior based on their interactions. These include regular clicks, link clicks, deadclicks, rage clicks, mouse moves, and zooming.
- Grouped heatmaps: This feature allows you to visualize aggregated data from multiple pages on a single heatmap. It can be extremely useful for grouping pages based on the same template (like a product page or article) or for grouping the same page with different parameters (e.g. a landing page that can be accessed via Facebook, Google Ads, or paid campaigns; or a thank-you page after a purchase, where each customer receives a unique purchase ID added to a link as a parameter).
How to tell real anomalies from the norm?
An anomaly in data refers to an observation or data point that significantly deviates from the expected or typical pattern of the dataset. In simple terms, it's something that stands out as unusual, like finding a red apple among a bunch of green ones. To distinguish a real anomaly from the norm, you compare it to what you normally expect to see based on past data or established standards. If it appears very different from the expected pattern, it's likely an anomaly.

Anomalies provide clues for deeper user behavior analysis, as they often signal usability issues, technical problems, or sources of frustration. However, depending on the context of the product, what may seem unusual or abnormal in one situation could actually be completely normal in another.
For example: imagine you're analyzing website traffic for an online store. On a typical day, the website receives 1,000 visits. Yet, during a special promotion, the traffic spikes to 5,000 visits in a day. In the context of the special promotion, the higher traffic of 5,000 visitors becomes the new norm. While it might appear as an anomaly when compared to regular days, in this specific context, it's perfectly normal.
Using CUX to Detect and Analyze Anomalies
So, how can you use CUX to identify and analyze anomalies effectively? Here's my go-to method:
- Get a good overview of the entire product or its specific section, depending on your analysis strategy and goals, as discussed above.
- Detect anomalies. The most common examples are:
- Drop-offs on Waterfall steps that are significantly higher than other steps;
- Dense heatmap areas for Experience Metrics, such as rage clicks, dead clicks, or zooming;
- Significant differences in metrics between traffic segments. For instance, in a comparison between converting and non-converting segments, you might notice that the majority of visits come from mobile devices, while most conversions occur on desktops.
- Growth or drop in metric values when comparing two periods. It could be any metric in Goals or Experience Metrics values.
- Check for possible external factors that might be causing these anomalies. These could include seasonal changes, increased traffic from promotions (as mentioned earlier, website design/functionality changes, or adjustments to your tool's configurations). This is the first step in distinguishing anomalies from the norm.
- Investigate what user actions are behind these anomalies that weren't explained by external factors. CUX makes this step easy by linking almost every anomaly in data to relevant user recordings. Whether it is a drop-off on a step in user journey, a metric in a goal, or a page URL in the Experience Metrics tab, you're just a few clicks away from uncovering what specific user behavior caused an anomaly. Keep in mind that some anomalies may turn out to be a type of norm, like users rapidly clicking navigation arrows in a product image gallery to view their desired product faster. Initially, without any context, this action might be mistaken for rage clicking.
- Remember that there are cases where understanding the user's intent behind a specific action is crucial. It is a perfect moment to reach for Voice of Customer(VoC) data to enrich your analysis with direct insights from your users. For example, if you've observed that many users are leaving their shopping carts without completing a purchase, simply watching recordings may not reveal why exactly they're not buying. This is especially true when there are no critical issues on the page. Therefore, it could be a good moment to run an additional survey on that page to find out why users abandon their carts. You might discover that users need more time to make a decision, are unsatisfied with the delivery costs, or are waiting for some promotions or coupons. This information could reveal that the anomaly you initially identified is actually a norm for your specific product.
How to build user flows and personas based on your data?
Every UX/Product designer knows that user flows and personas are often created in the early stages of product development. However, once the product is up and running, it is essential to revisit and refine it based on the data you've collected. It's important because it ensures that your product is designed and fine-tuned with a deep understanding of how real users actually interact with it.
Data-driven personas allow you to construct profiles that reflect the actual preferences and needs of your audience, guiding the development of features and content. User flows based on data streamline the user experience, leading to improved conversion rates and user satisfaction. This approach minimizes guesswork, optimizes resource allocation, and ultimately leads to a more user-centered and successful product.
How to build user flows using CUX:
- Collect observed data: Begin by analyzing visits recordings, click and move Heatmaps to understand how users currently navigate through the product. If you have a clear endpoint for a flow, such as a purchase or submitted form, consider setting a Goal. This will help you filter all relevant visits more efficiently, allowing you to spend less time searching and more time analyzing user behavior and watching recordings.
- Identify common paths: Use the insights from your observed data to identify the most common user paths and interactions. Pay attention to the starting point of each journey and its length - not every user journey starts from the main page; some users may return directly to their shopping carts or even to the checkout page.
- Map out user flows: Create visual representations of user flows incorporating the common paths and interactions you've identified. In CUX, you can do this by building a Waterfall. This feature not only displays the mapped-out flows but also helps you track user drop-offs, discover reasons behind them, and monitor their progress over time.
To create effective user personas, leverage various types of data. Registered data like age, location, and preferences help categorize users. Voice of the Customer feedback provides insights into pain points and motivations, enriching persona profiles. Observed data obtained from session replays and heatmaps uncovers common behaviors, refining personas to reflect user behavior and preferences more accurately.
CUX is particularly well-suited for creating behavioral-based personas. It offers various ways to create Goals based on single or multiple events, delivering an ideal representation of behavior-based segments (e.g., filling a specific form, using promo codes, visiting specific pages, or using a website search). When combined with the basic statistics automatically provided for each goal, like device usage, traffic source, or entry page visits, it enables a deeper understanding of your product from your users' perspective.
Ready to harness the power of data for your product? Begin a free CUX trial and take your user insights to new heights!