August 25, 2025
14 min read
5 ways to achieve good user behavior analysis using Visits Recordings
Imagine you're a secret agent. Every secret agent has their gadgets that help them in a mission. Sometimes an agent needs a weapon, but sometimes to accomplish their goal they need a more tactical tool.

Max Plociennik
Growth Product Manager at Benefit Systems and Owner of PRIV Media

You are here because you have a mission too – you want to know how visitors interact with your website, what causes friction on certain pages, and how you can improve customer experience in general.
Yes, you also have gadgets like Heatmaps, Waterfall/Funnel Analysis, and Visits Recordings. And the last gadget is exactly your spy glasses.
This is a guest post from Max Plociennik, Growth Product Manager at Benefit Systems and Owner of PRIV Media. – One-Man Marketing Agency. V-shaped guy with strong analytical and business-oriented skills. Startup freak.
In this article, I'll show you how you can use above mentioned spy glasses. In other words, here are 5 ways to use Visits Recordings to analyze user behavior on your web page. Let's dive into it!
What are Visit Recordings and how do they differ from user session recordings?
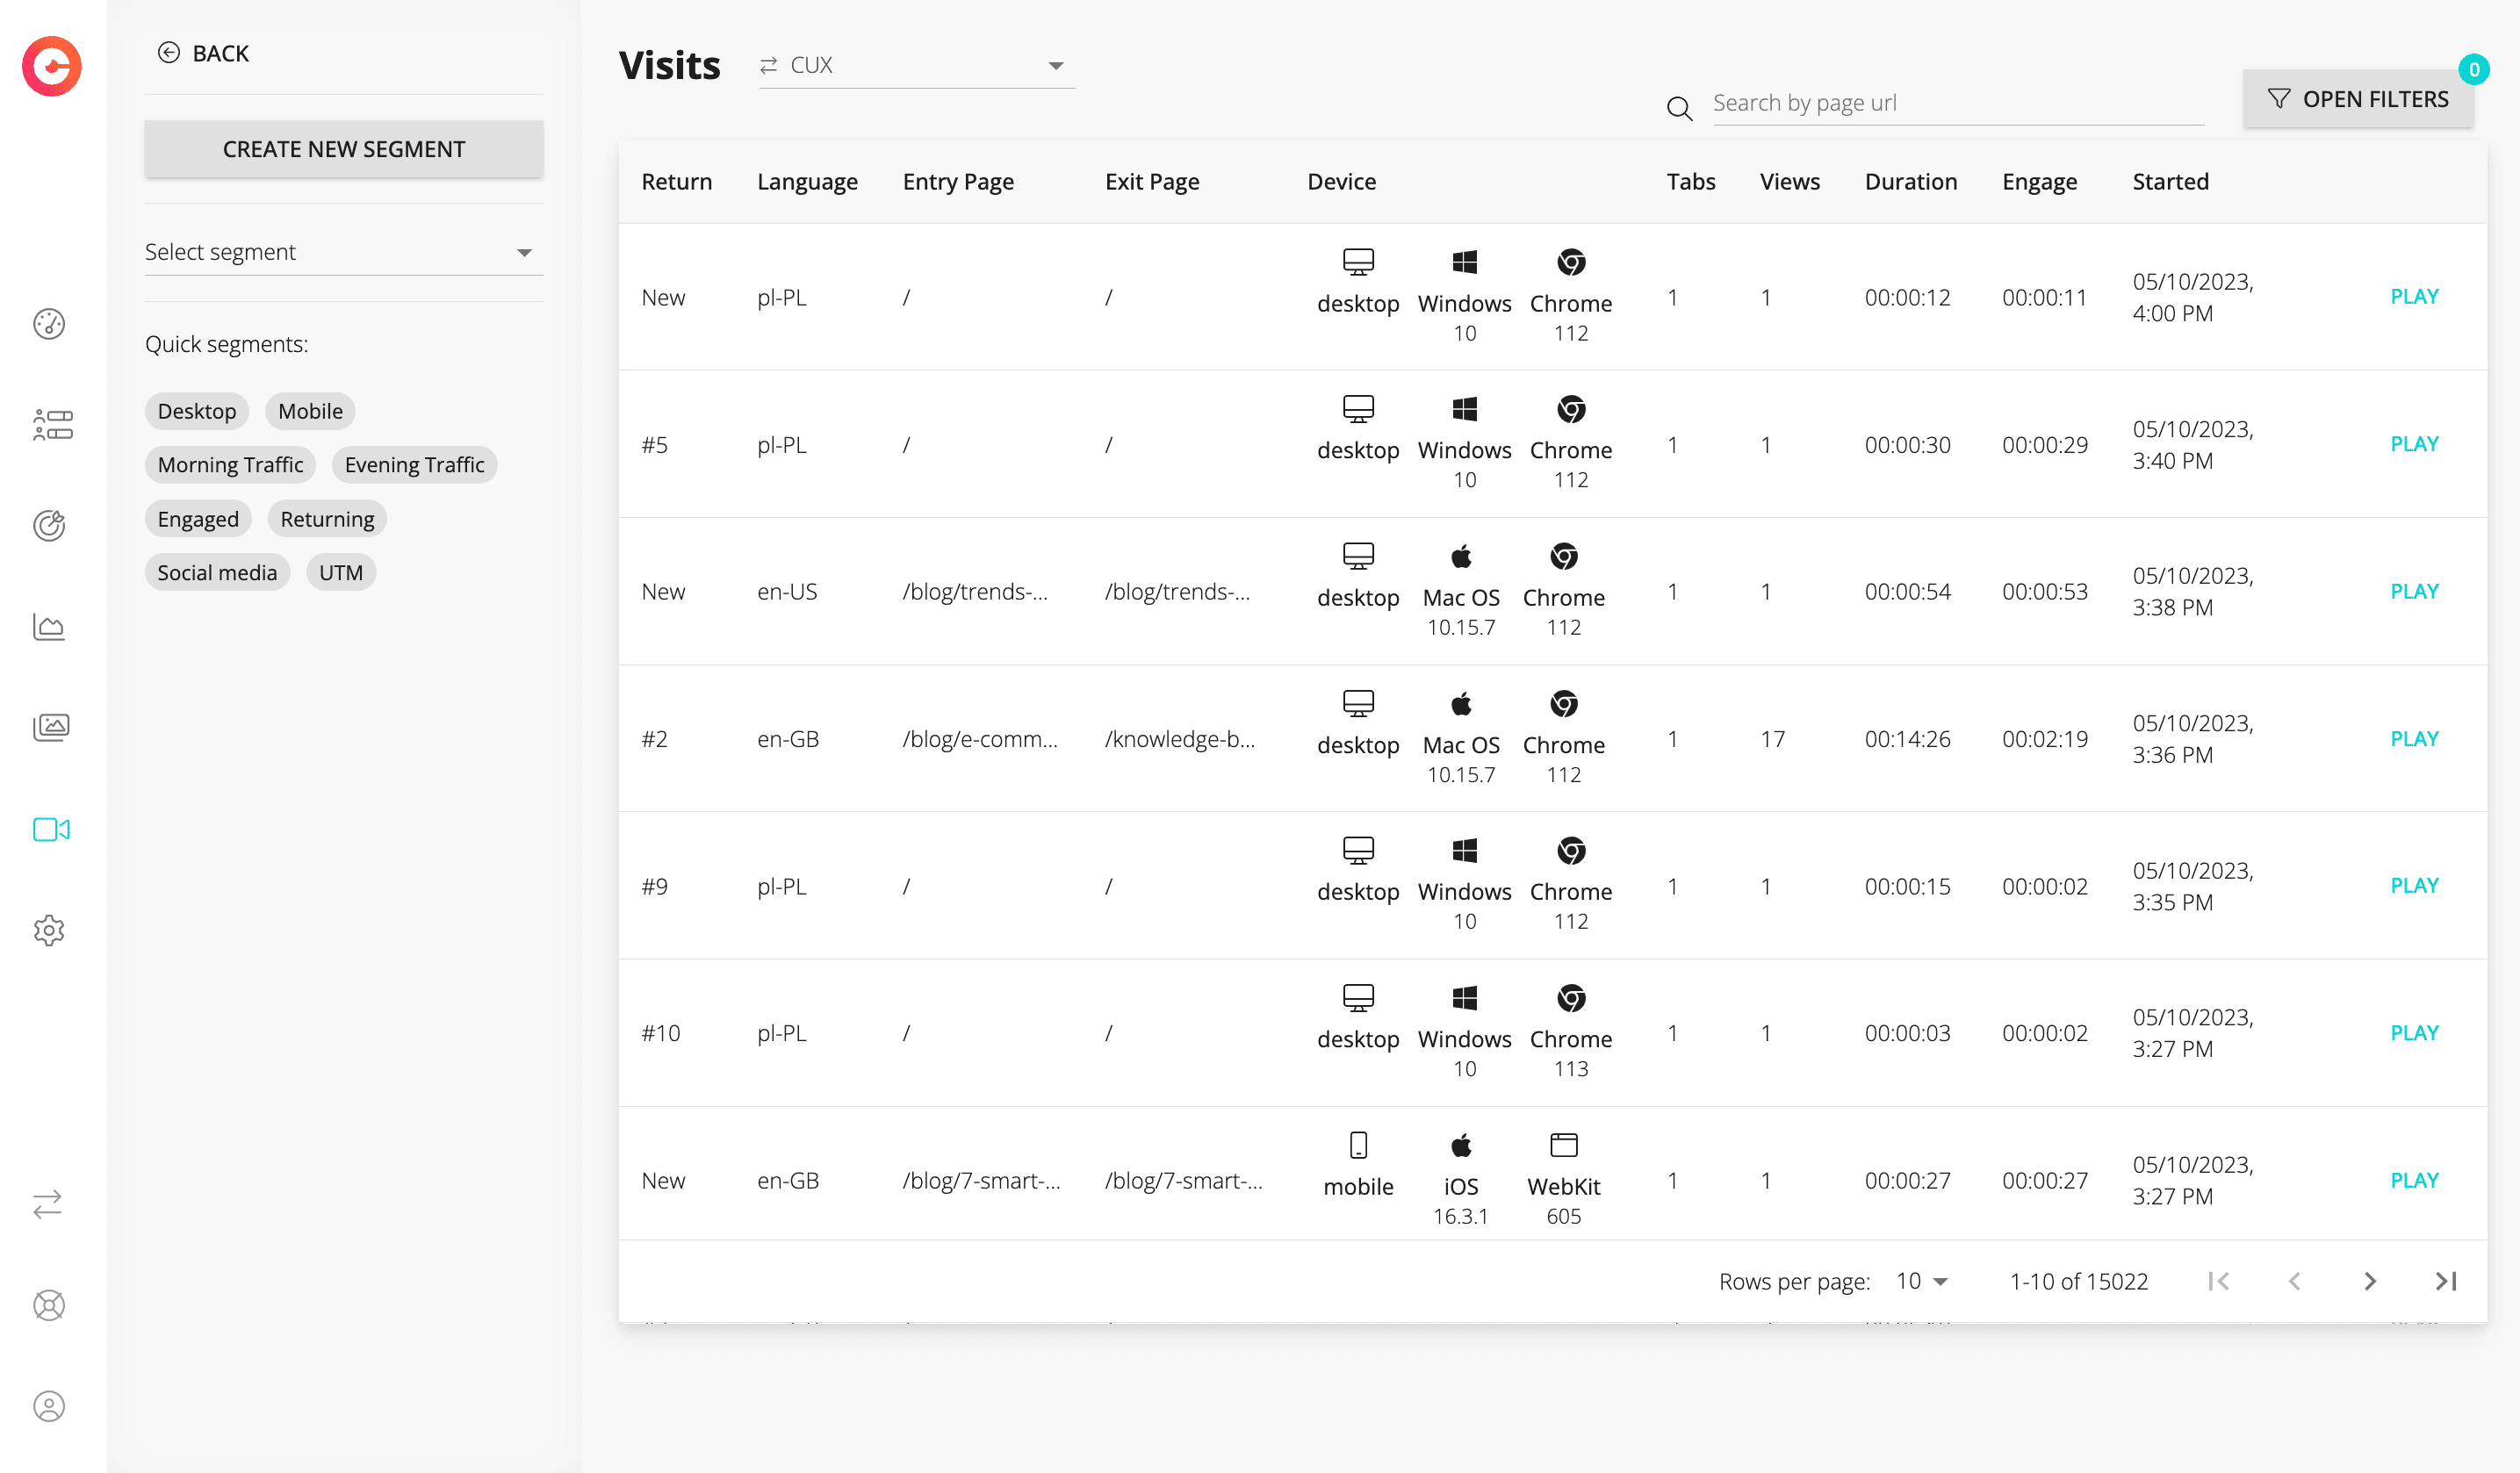
Visit Recordings are videos of actual user activity as they navigate around the landing page, the entire site, or the e-commerce store no matter how many tabs they have open.
The Recordings automatically capture every type of user action: from scrolling and mouse movements to clicks, taps on a mobile device, keystrokes and even jumping from one page to another.
Yep, we see everything visitors do or their point of view to be very precise – hence the comparison to spy glasses. 😉
But to fully understand how visit recordings differ from session recordings, you should know the difference between a visit and a session.
Google Analytics says:
"A session is a group of user interactions with your website that take place within a given time frame. For example, a single session can contain multiple pages, page views, events, social interactions, and e-commerce transactions."
However, there is one important thing to remember – a session usually ends after 30 minutes of inactivity:
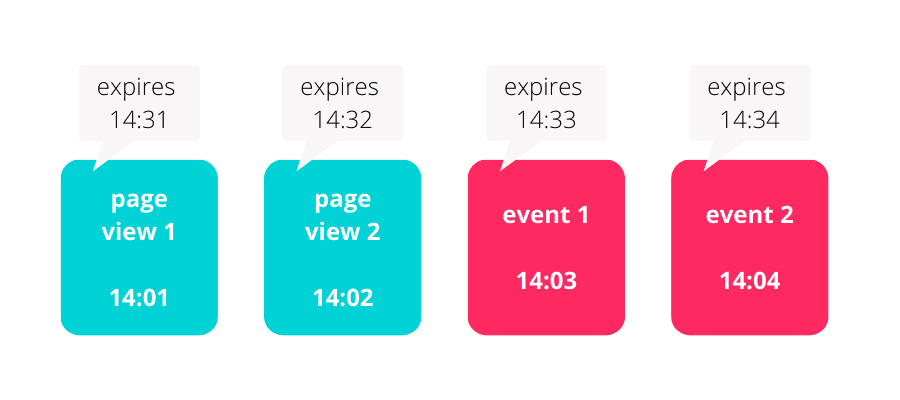
So we can imagine that sometimes we have multiple website session recordings of one user separately. It is certainly not comfortable, when we have to watch recordings one after another.
That's why cux.io, a digital web analytics tool, has Visit Recordings that create one user recording regardless of how much time users spent on a particular page and how many tabs they opened.
What type of insights can you get by watching visit recordings of your users?
When creating websites, stores, landing pages, or mobile apps, what you usually have in mind is an ideal path from the entrance to the specific page (Thank you page), screen (Upgrade from the free plan), or action (Add to cart). This path is what we call the Customer Journey Map (more specifically, CJM is more holistic and usually extends beyond the website itself).
Therefore, we assume that we know how users interact with the website, but the actual user journeys are completely different and will surprise you many times by how they use what we've built.
That's why visitor recording software is so important – we jump into users’ shoes and discover their world.
So session playback tool tells you:
- whether your site visitors are deviating from the conversion funnel,
- which users actions signal points of frustration,
- whether your content is clear to users (call to action, graphics),
- which key features are most frequently used in your product,
- when and why users abandon website forms or the entire conversion funnel.
User sessions do not expose only website visitor behavior. They can also show you performance problems:
- functionalities that don't work,
- network and javascript errors that users encounter,
- pages that load incorrectly on the certain devices/resolutions,
- broken or missing elements.
Fun Fact: You can sometimes see session replays of crawler/scraping bots. Of course, not Google robots-spiders, but from other projects, even from Venture Capital (VC). Yes, you read correctly – I've worked on 2 projects where I saw that one Venture Capital bot crawled our home page to collect data about the next potential investment to form a transaction opinion. How do I know it's a VC bot? Each user and bot is marked with its own "User-Agent". It's enough to notice if the visitor’s sessions in the Browser field have a known name (Chrome, Firefox, Safari, etc.) or a proper name. Here you find more detail about the VC crawler.
As you can see, visitor sessions are extremely valuable to your marketing and product team. Even customer support can get help if we implement the session replay tool in a certain way.
What is user behavior analytics?
We can explain this concept with one word: dogs. How can I compare user behavior analytics to these cute pets?
You may remember that there is a person who knows about the behavior of dogs – a behaviorist. A behaviorist tries to understand why animals react in certain ways and how they can change their bad habits into good.
Same when we analyze user behavior – we try to understand why visitors interact with the site in particular ways and how we can improve their user experience, which is usually not the best at first.
We can analyze user actions through quantitative and qualitative data.
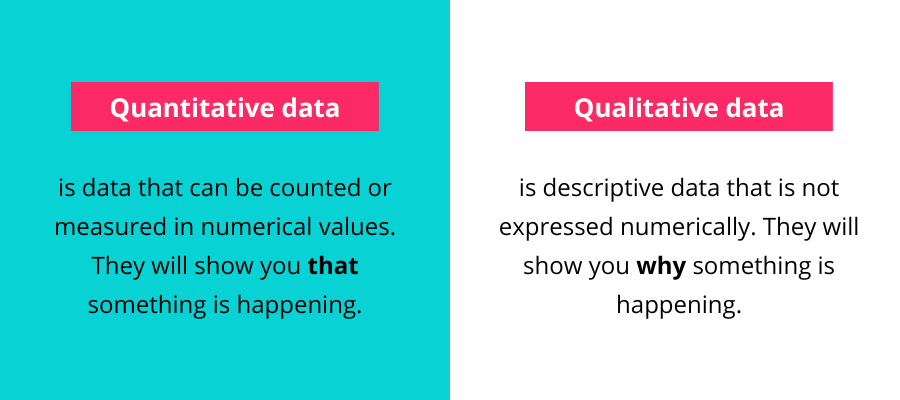
Quantitative data – as you can guess – is numbers. So every group of stats, charts, or metrics tells you what happens, but not why or how it happens.
For example, you have data about which pages were viewed, which goal was completed, form analytics, and even device type or the operating system. You can measure this by implementing one of several web/product analytics tools: Google Analytics with Google Tag Manager, Piwik, Mixpanel, Amplitude, or Woopra.
Qualitative data allows you to understand people's motivations, thoughts, and attitudes. This type of data reveals a full picture of what and how is happening on your website or app.
It won't surprise you that you can see this data by implementing session replay tools or continuous feedback platforms.
5 ways to good user behavior analysis by using visit recordings
Identify and remove bugs that destroy the first impression
Research shows that when you meet someone new, the first 4-11 seconds are the most important.
Theoretically, we can observe the same when we're on any page for the first time. We judge if the page is helpful and valuable for us.
But we can ruin the first impression by:
- server and page loading errors,
- incomprehensible or misleading navigation,
- slow page loading,
- visitors landing on a page that doesn't match their intentions,
- poor contrast between text and page background.
What proves that we have a terrible UX and probably users leave our site quickly?
- Chaotic mouse movement,
- Rage clicks,
- Low scrolling depth,
- Confusing content e.g. non-clickable elements,
- Forms that users have to spend a few hours filling out,
- Returning to the same page multiple times.
Pro Tip: By definition rage clicks are bad, but not in every situation. Sometimes users click on the scroll bar thousands of times to move down the page. Seriously – I saw this a lot of times. So, if you notice "Rage clicks" when you analyze session recordings, don't panic. 😉
Perfect the crucial places for your Conversion Rate or other business metrics
Each type of business has its crucial places that influence your KPIs, business metrics, or simply depth of user engagement.
In e-commerce, we can distinguish 3 of them:
- product page,
- signing up on the store,
- adding the product to the cart, and the entire checkout process.
Sometimes 2nd and 3rd are combined.
If we notice that many users choose the checkout page as the exit page, or we have quite a lot of traffic but no one signs up/adds the product to the cart, we need to look at these 3 places.
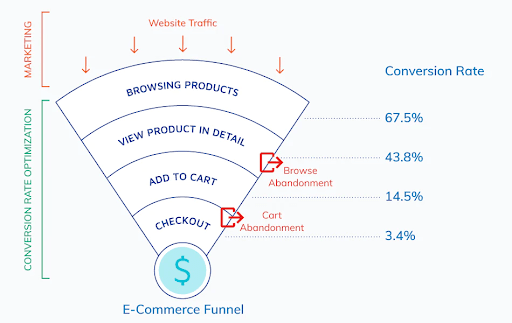
Source: https://www.tradehike.co/
For example, I remember one situation when I was analyzing session recordings in a store. One user, after adding a product, tried to click on the top bar to enter the cart, so it was quite a normal thing. But this bar only appeared for 3 seconds and disappeared. So they tried to hit this bar 3 times but finally left the store.
Why? This user felt silly because they didn't understand how something worked. This situation was friction on their way to purchase.
So what did we do? We extended the display of the bar to 5 seconds to avoid the same situation. A simple thing, but sometimes it's enough to improve conversions and overall sales.
In the case of a startup, it can be more than 3 spots – it depends on the complexity of the project and a business model:
- sales contact form,
- signing up/getting a trial plan,
- subscription upgrade,
- places with core values for users.
When you need to tackle conversion rate optimization, I recommend focusing on these points first.
Identify and fix UX issues that are causing low engagement on specific devices or resolutions
For about 12 years, we marketers have been saying the same phrase like a mantra: "This is the year of mobile devices." But is it true?
I can answer this with a quotation from a famous meme:
And before you send a dozen hungry wolves after me, I want to show you 2 screens from GA:
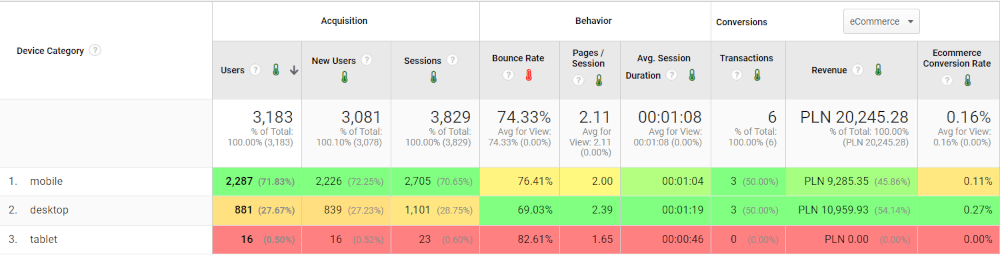
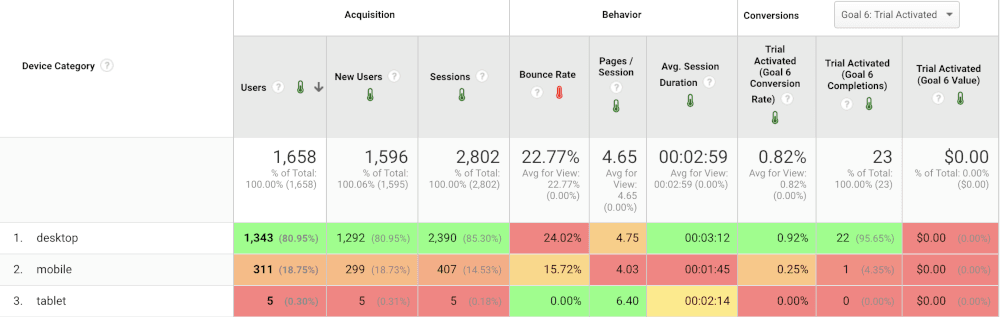
The first graphic is B2C business statistics, more specifically e-commerce. The second one is from the B2B business (SaaS model). So, we see that the size of mobile traffic is dependent on the type of business.
What does it mean for us?
If you only have 10-20% mobile traffic, but you don't have the time and human resources to work on conversion rate optimization on these types of devices, that's OKAY. Of course, at some stage, you should tackle mobile traffic, because that's where the money is. And that’s where user sessions recordings come in handy.
But if your business relies on mobile traffic, you need to be "mobile-first".
What about screen resolutions?
Have a look at these stats:
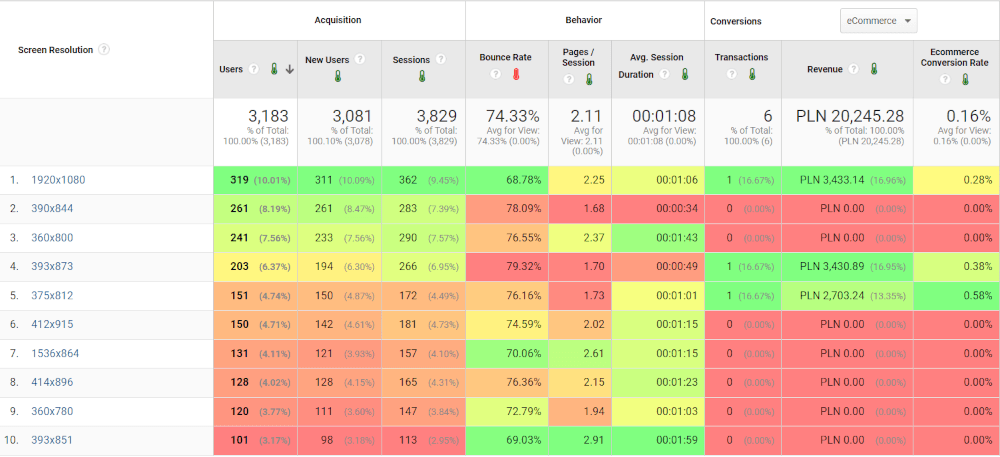
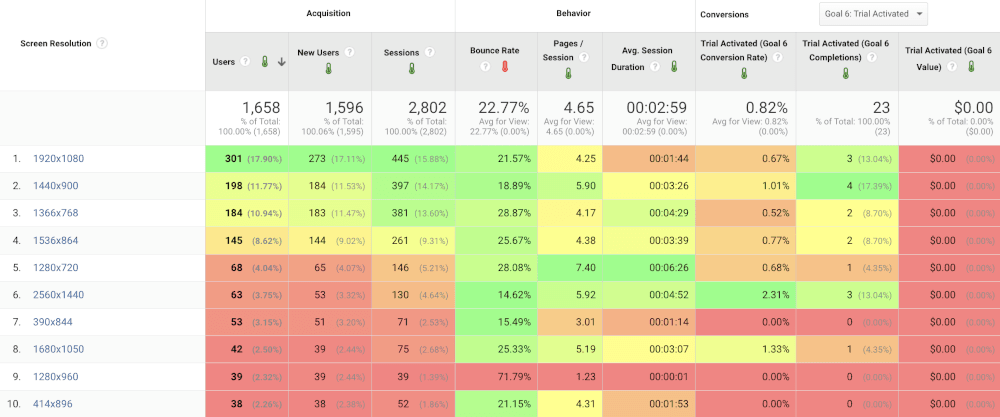
As you can see in the screenshots above, we don't have 2-3 most popular resolutions among website visitors – there’s many more of them..
So, what can we do now?
- Check the proportion of mobile-desktop traffic. Which one is dominant?
- Check the most popular resolutions used by your users.
- Filter session replays by device/resolution to catch UX issues. Gather data and create the repair plan (hypotheses for A/B test, list of bugs, etc.).
Pro Tip: If you use Chrome, I recommend downloading the DaVinci extension – this plugin is pretty cool because it adds the colors (as you can see in the screenshots), so you can analyze and process statistics faster than without it. 💪
Find out how users behave after rolling out new features or products
When you roll out a new feature or product, it can feel like giving birth or launching a new ship. And you want to know what the whole world thinks about your new “baby”.
Session recording tools allow us to see how users interact with a new feature or product – do they like it or do they give us signals that we should improve something. We may segment users or use cohort analysis to try to find our power users or find a pattern as to why users have low engagement:
One day, I analyzed the website visitors and their behavior during the process of buying tickets to workshops for music producers. Some users received a discount code for the cheapest plan because they participated in previous editions of the event.
I remember one user tried to use this discount code on the highest-priced plan and left the site because that coupon didn't work.
I showed the visitor recording to the organizer and told him to try to contact this user and gift the code for the most expensive plan. Of course, he had to be smart, because people shouldn't know that we see their mouse movements, clicks – you know, the privacy of sensitive data and so on.
And we did it – we made extra sales (upsell) because I noticed it after replaying the session.
Check out how your A/B testing performs in practice
When you run an A/B test and use Google Optimize (rest in peace our angel), you analyze quantitative data, the test results in numbers, so you only see the bare facts. Thanks to session recordings, you can see with your own eyes how website visitors behave with a different variant of text, graphics, or a new layout.
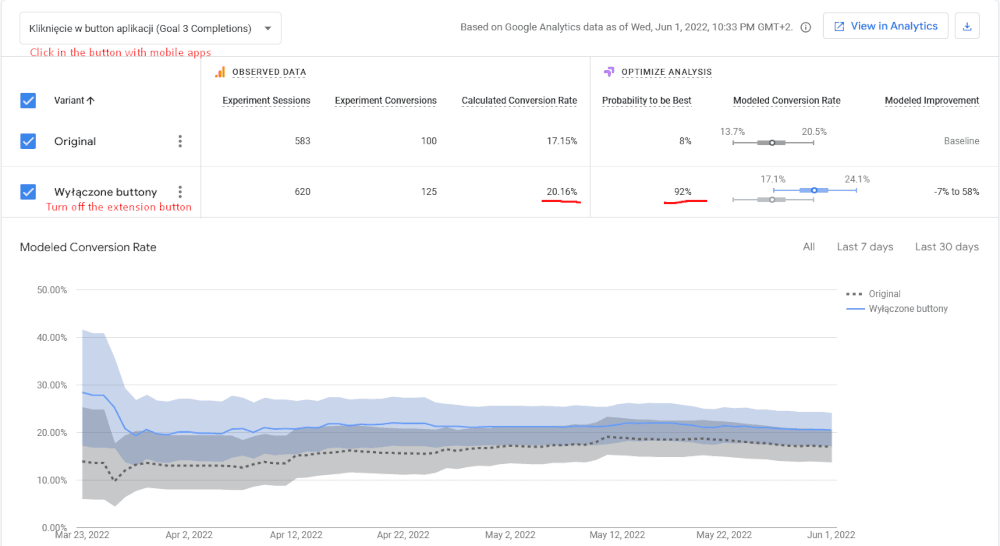
For example, I noticed that mobile users clicked a button to download a Chrome extension, but using the extensions on mobile browsers is technically not possible. And mobile users did not convert to mobile apps because they wanted the extension.
So I launched A/B test:
- 50% of mobile users see only buttons with mobile apps,
- the other 50% of mobile users see buttons with mobile apps and the Chrome extension.
The result was obvious – users with buttons for mobile apps only convert better than users from the second group. And of course, using session replay software, I was able to see how these users interact with the landing page during my A/B test.
How many recordings do I need to watch?
I think it depends on the traffic volume and the complexity of the project. You can't go through hundreds of recordings all day, so it's a good practice to break your site, app, or product into smaller chunks.
Let's get back a few paragraphs and check out the list of key places for your business again.
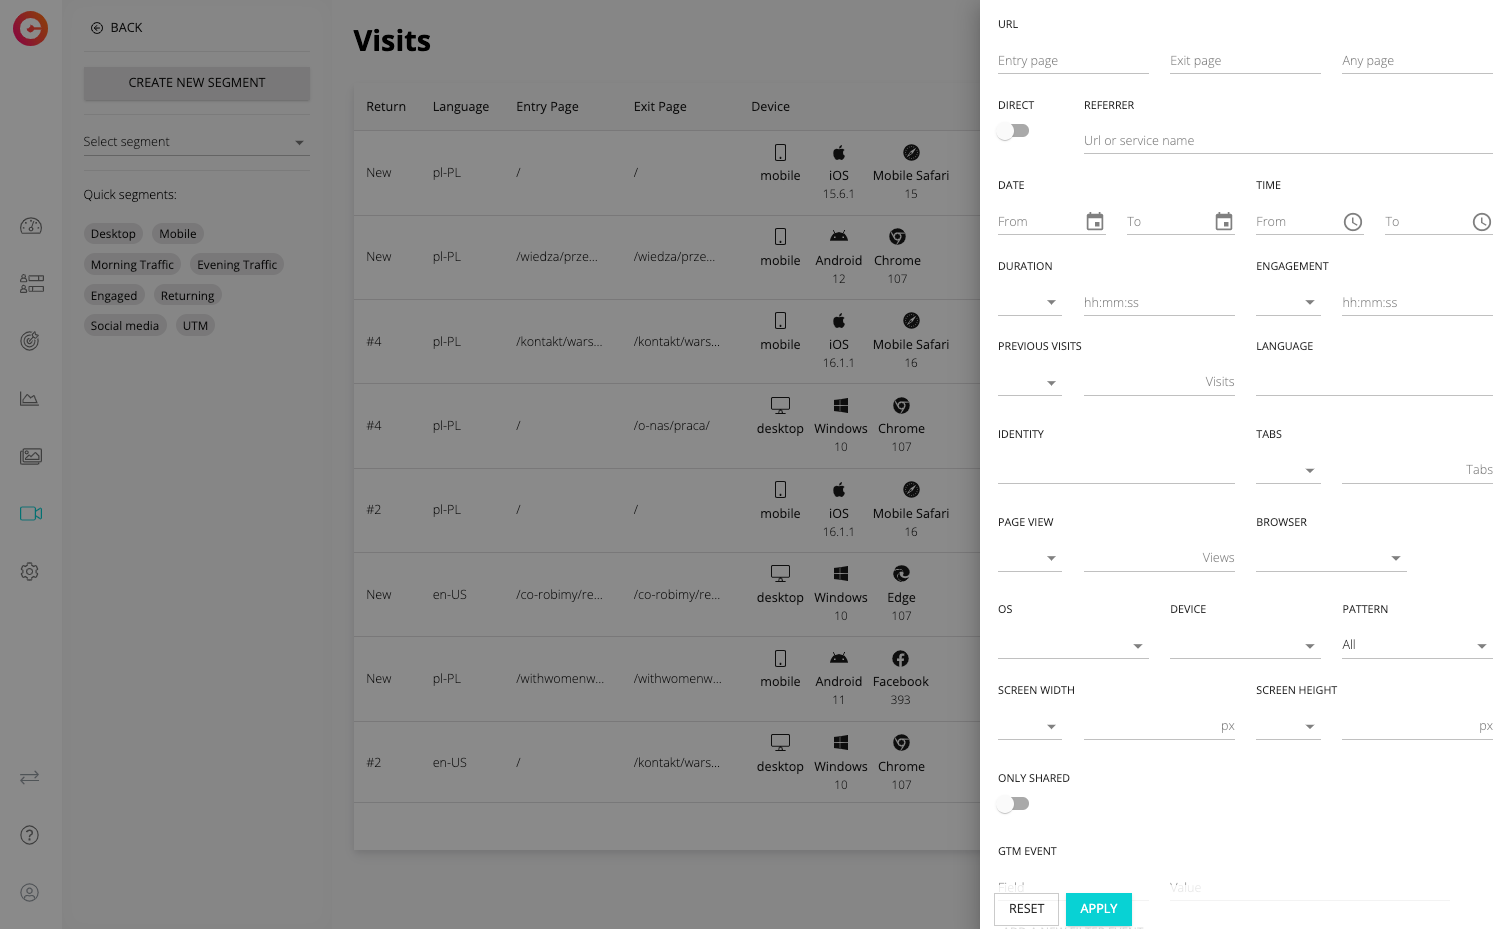
Suppose we need to improve the registration form because we noticed that we have a problem with this process. In session recording tools such as cux.io, we can segment users by page visits, new/returning users, type of device, geo-location, referral, etc.
After the segmentation, we can go to view recordings. But how many?
Sometimes you only need to watch 5 recordings and you can already see the problem, but sometimes it takes even 30 sessions to see what the issue is.
If you don't see anything or feel like "the job is done", you can run an A/B test to see if you're right. But let's be honest, the work never ends – there's always room for improvement. 🚀
Which tool to visit/session recordings should I choose?
Personally, I believe that a perfect session recording tool doesn't exist. In my humble opinion, if we combine 3 or 4 recording tools, we get the best website visitors analytics software. But of course, we can't do that, we don't have enough time to use 3 solutions at the same time.
So, to choose the best session recording tools, you should consider:
- your needs,
- type and stage of your project,
- human and time resources.
Why are these 3 factors so important?
You need to know what you want to do with the tool and what key features will give you valuable insights into visitor behavior.
Not every session recording software is suitable for every type of project. Some are more complex than others, but some are more geared toward a specific type of business, such as e-commerce or startups.
Someone needs to use the chosen solution and should have enough time to analyze the website visitors and the valuable data collected to improve conversion rates.
When you have considered the above 3 points, you are ready to implement one of several popular analytics tools in your company:
- cux.io
- MouseFlow
- Hotjar
- Smartlook
- LiveSession
- CrazyEgg
- Clarity
Which one is the best session recording tool? Let everyone decide for themselves. 😉
Final thoughts
In today's article, I showed that every project should have its spy glasses and how many opportunities we have to improve the Conversion Rate, other metrics, or overall user experience by using Visits Recordings.
I hope that my knowledge, experience, and detailed insights help you improve your business.