August 21, 2025
14 min read
The Basics of User Behavior Analysis - CUX Complete Guide
In the ever-evolving landscape of digital experiences, understanding user behavior has become a cornerstone for businesses striving to stay ahead.

Karolina Szafarz
Head of Marketing at cux.io

What Is User Behavior Analysis? {#What-Is-User-Behavior-Analysis?}
Unlike simple quantitative metrics such as clicks and scrolls, User Behavior Analytics best practices delve into the qualitative aspects of user interactions. It provides insights into the motivations, preferences, and intentions of users. It's like having a secret tool that allows you to understand the psychology behind user actions, and uncover the "why" behind their online behavior.
By leveraging User Behavior Analytics best practices, businesses can reveal hidden patterns, identify pain points, and explore opportunities to enhance user journeys. It's a powerful tool for gaining a deep understanding of user sentiments, preferences, and the factors influencing their decision-making process. This knowledge is invaluable for making informed decisions, optimizing user interfaces, and tailoring digital content to create a more engaging and user-friendly environment, which ultimately leads to increased conversions and improved overall performance.
Examples of qualitative questions that UBA can address include:
- Why do users visit the website? What specific elements capture their attention during online interactions?
- What factors influence users' preferences for certain products or features?
- What challenges or frustrations do users encounter when navigating the site or utilizing specific features?
- Which features or content do users perceive as the most valuable and engaging?
- What are users' expectations regarding the design and functionality of products? With UBA, you'll get the scoop on what your audience loves (and doesn't) so you can make your digital space a place they adore.
Here with the User Behavior Analysis, you can:
- Verify the problems and frustrations of your customers,
- Craft user personas and behavior profiles,
- Make journey maps that truly resonate with your users,
- Enhance your marketing strategy,
- Boost sales (who doesn't want that?),
- And a whole lot more!
Understanding User Behavior Metrics: Key Indicators for Success
Navigating the landscape of User Behavior Analysis requires a reliable compass – and that compass is metrics. These metrics go beyond numbers; they're like vital signs for your website's health, showing you how engaged and satisfied your users are. The most important Key Performance Indicators (KPIs) for User Behavior vary depending on the specific goals and objectives of a business or website. However, some universally significant User Behavior KPIs include:
- Time on Page: Measures the average time users spend on a particular page during their visit. A longer time usually indicates greater engagement.
- Bounce Rate: Determines the percentage of users who navigate away from the site after viewing only one page. A high bounce rate may suggest that visitors are not finding what they're looking for or that the content is not engaging.
- Visit duration: The entire time a user dedicates to exploring a website during a single visit. It underscores the importance of analyzing the entire user journey, considering potential interactions across multiple tabs.
- Exit Rate: Indicates the percentage of users who leave the site from a specific page. High exit rates on particular pages may signal issues or lack of interest in that content.
- Conversions: Tracks the number of users who perform a desired action, such as a purchase, signing up for a newsletter, or filling out a form. A higher conversion rate typically indicates effective user engagement.
- Conversion Funnel: The steps users take before completing a conversion. Helps identify potential problem areas and optimize the conversion process.
- Trust Metrics: Evaluate the level of user trust in the website, products, or services. It may include reviews, ratings, and security certifications.
- User Retention: Measures how well a website retains users over time. Analyzing user retention helps understand the long-term appeal and effectiveness of the platform.
However, when we want to understand how users really use a website or product, we need more than the usual numbers. And as we want to share with you valuable user behavior tracking tips, that's where experience metrics come in. Tools like cux.io help us capture and analyze them. These metrics show us the detailed ins and outs of what users do, like, and where we can make things better. Let's dig into these metrics to make the user experience even better:
- Zooming - the action of adjusting the size of content on a screen, often done by users to enlarge or reduce elements for better visibility or usability. When visitors zoom in on your site, they're giving you valuable feedback without saying a word. Whether it's to read tiny text or admire the details of a product image, zooming highlights areas for improvement in accessibility and design.
- Chaotic Movement - happens when users are moving their cursor around in a messy or confused way on a website. It shows they might be having trouble finding things or understanding how the website works. Chaotic Movement signals user confusion, which, once understood, opens the door to simple yet impactful changes. Enhancing your site's navigation and layout can not only improve the user experience but potentially boost sales by making the journey to purchase smoother and more intuitive.
- Refreshing - tracks unexpected page reloads, which could be due to slow load times, incomplete content display, or layout issues. Hidden refreshes can frustrate users, often without site owners even realizing.
- Dead Click - happens when a user clicks on something on a website, expecting it to do something, but nothing happens. It's like trying to press a button that doesn't work.
- Rage Click - an instance where a user repeatedly clicks on a part of a website or application in a very short period, usually out of frustration or confusion. It shows there might be a problem or something not working as expected on that part of the website. It's a big red flag showing us exactly where a website is letting users down and sparking their frustration.
- Refreshing - the number of visits where the content on your website was refreshed, either by the user or automatically - as a result of some user actions.
- Bounce Back- occurs when a user enters a website and promptly goes back to where they came from. It can happen due to reasons like mismatched content, slow loading times, or confusing navigation.
There are a lot of metrics that can help you understand users' behavior and make the analytics journey exciting. The fun part is that it's not only about numbers but real motivations and intents. Each click, scroll, and interaction is a digital footprint that unveils the story of user engagement. Metrics like time on page, bounce rate, and conversions provide the foundation, while experience metrics like Zooming, Chaotic Movement, Refreshing, Dead Click, Rage Click, and Bounce Back add color and depth to the narrative.
Understanding the human aspect behind the clicks transforms analytics into a captivating journey where websites evolve based on genuine user needs.
Common Sources of User Behavior Data
The tapestry of User Behavior Analysis is woven from diverse threads of data, each contributing to a richer understanding. Web analytics tools (e.g. CUX), heatmaps, user surveys, and customer feedback collectively form the mosaic of insights. This comprehensive approach enables businesses to construct a holistic narrative of user behavior, transcending the limitations of isolated data streams.
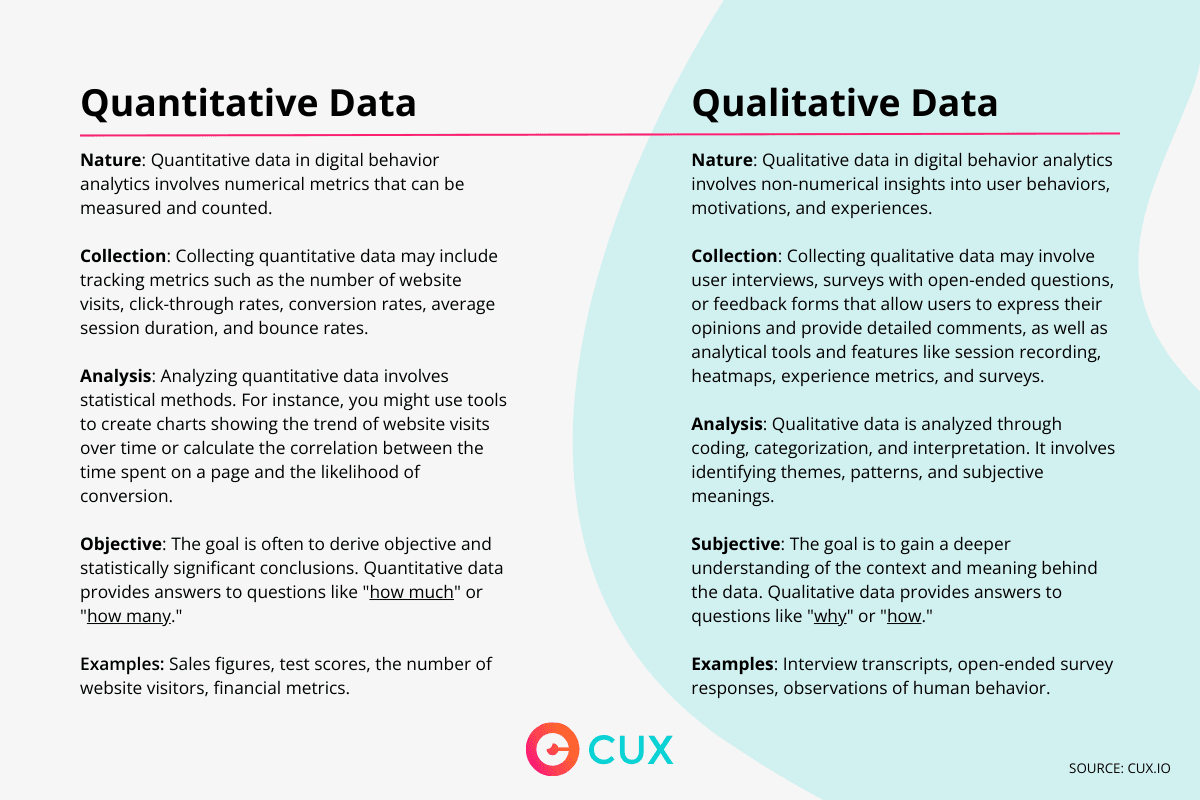
Quantitative vs. Qualitative Data
Our data story has two main characters: quantitative data, which is all about numbers, and qualitative data, which brings in the human touch with comments and feedback. One of the best user behavior tracking tips is as follows: Balancing these two gives you a full understanding of what's going on.
EXAMPLE: Optimizing an E-commerce Website
Quantitative Data:
- Metric: High Bounce Rate on Product Pages.
- Observation: The analytics tool indicates that a significant number of users are leaving the website after viewing only one product page.
Qualitative Data:
- Session Recording: Watch session recordings of users who exited from product pages. Identify common patterns, such as users spending minimal time on the page or encountering usability issues.
- Heatmaps: Examine heatmaps to see where users click the most on the product pages. Are they interacting with product images, descriptions, or reviews? Identify elements that attract attention and those that are ignored.
Combined Insights:
- Identifying Pain Points: Session recordings reveal that users often encounter difficulties in the checkout process. They may hesitate or abandon carts due to unclear navigation.
- User Preferences: Heatmaps show that users frequently click on product images but rarely engage with lengthy descriptions. They seem to prioritize visual elements.
- Survey Integration: Integrate a survey at the checkout exit point, asking users about their experience. Qualitative responses may highlight frustrations with the checkout process or concerns about payment security.
- Actionable Steps: With a combined understanding of quantitative and qualitative data, you can take targeted actions. For instance, optimize the checkout process based on specific pain points identified in session recordings. Improve visual elements on product pages to align with user preferences. Address concerns raised in surveys to enhance user trust.
By combining both types of data, you gain a comprehensive perspective on user behavior – understanding not only what is happening (quantitative) but also why it is happening (qualitative). This holistic approach empowers you to make strategic and user-centric improvements to your e-commerce website.
How To Perform a User Behavior Analysis?
It's a step-by-step journey that involves setting clear goals, picking the right metrics, gathering data, and making sense of it all. Wondering what to begin with? Here's a suggested starting point:
- Define Clear Goals: User behavior best practices start with defining the specific goals and objectives of your analysis. What do you aim to achieve? Whether it's improving user engagement, increasing conversions, or enhancing overall user experience, having clear goals will guide your entire process.
- Identify Key Metrics: Select the key performance indicators (KPIs) that align with your goals. Consider metrics like bounce rate, conversion rate, time on page, or experience metrics such as rage clicks or bounce back. These metrics will serve as the foundation for your analysis.
- Choose Analytical Tools: Explore and choose the right analytical tools for your needs. Depending on your goals, tools like Google Analytics, Hotjar, or CUX.io can provide valuable insights. Ensure that the selected tools align with the type of data you want to collect, be it quantitative, qualitative or the best option - both.
- Set Up Tracking: Implement tracking codes on your website to collect quantitative data. This includes page views, click-through rates, and other relevant metrics. Configure your analytical tools to capture user interactions effectively.
- Dive into Qualitative Analysis: Integrate qualitative analysis features such as session recordings and heatmaps. Dive into user sessions to understand their behaviors, pain points, and areas of interest.
- Segment User Data: Segment user data based on demographics, behaviors, or other relevant factors. Understand how different user groups interact with your website and whether there are notable variations in behavior.
- Analyze User Journeys: Map out typical user journeys to identify common paths leading to conversions and potential drop-off points. Evaluate the effectiveness of conversion funnels. This step helps you understand the flow of user interactions on your site.
- Iterate and Optimize: Iterate your analysis regularly and make continuous optimizations. Implement changes based on the insights gathered, whether it's adjusting the user interface, refining content, or optimizing conversion processes.
- Share Findings and Collaborate: Foster collaboration between teams involved in website management, design, and content creation. Share findings and insights to ensure a collective understanding of user behavior and inform strategic decisions.
This systematic approach ensures a comprehensive analysis, empowering businesses with actionable insights for refining user experiences. Starting with these steps ensures a structured and goal-oriented approach to your user behavior analysis. As you progress, you'll refine your strategy based on the insights you uncover and the evolving needs of your users.
Key Features to Look for in User Behaviour Analysis Software for E-commerce
The selection of User Behavior Analysis software becomes a critical decision in pursuing accurate insights. This section outlines pivotal features such as real-time tracking, customizable dashboards, seamless integration capabilities, and user-friendly interfaces. Choosing the right tool is akin to selecting a trusted ally, ensuring smooth implementation and interpretation of behavioral data.
The most important functionalities are:
- Heatmaps: Visualize areas of the website where users frequently click, scroll, or spend the most time.
- Session Recording: Record actual user sessions, providing insights into how users navigate through a website or application.
- Visit Recording: Record the entire user visit, regardless of the number of tabs open or the duration.
- Quantitative and Qualitative Data: Choose a tool that allows you to collect and analyze the most important data in one place.
- Conversion Funnel Analysis: Track and analyze the stages users go through in the conversion process to identify potential bottlenecks.
- Auto-capture Events: Collect data automatically without any dev/IT skills.
- Retroactive Analysis: Create, compare and modify customer journeys using historical data
- Goal-oriented Analysis: Look for a tool that not only presents a complete picture of the data but also interprets the data about your business goals.
- User Segmentation: Enable grouping of users based on various criteria, facilitating the analysis of behaviors in specific segments.
- A/B Testing: Allows for comparing different versions of a page or feature to identify which version yields better results.
- Integration with Other Analytical Tools: Can collaborate with other data analysis tools, such as Google Analytics, for a more comprehensive perspective.
The Key Business Benefits of Behavioral Data Analysis
Behavioral Data Analysis provides valuable business benefits, empowering organizations to optimize user experience marketing strategies and make informed, data-driven decisions:
- Enhanced User Experience (Happy users): Gain deep insights into user interactions, preferences, and pain points to improve products, services, and interfaces for an overall better user experience.
- Informed Decision-Making (No more guessing!): Say goodbye to random decisions. Understand user behavior for data-driven ones. Know exactly what works and what doesn't, so you can make choices that pay off.
- Improved Conversion Rates (More sales!): Identify bottlenecks enhance the user journey based on behavioral insights, and watch your sales go through the roof.
- Personalized Marketing: Create detailed user personas with behavioral data to personalize marketing campaigns, increasing relevance and engagement. It's like having a personal shopper for everyone!
- Proactive Issue Resolution (Fix problems before they blow up): Spot issues before they become big problems. Detect patterns in user behavior to address issues proactively, contributing to customer satisfaction and loyalty.
- More Customers: Fine-tune user acquisition strategies by understanding how users discover and engage with products or services, investing resources more effectively.
- Beat the Competition: Stay ahead by leveraging behavioral data analysis, adapting quickly to user preferences and market trends, and outperforming competitors.
- Enhanced Product Development: Gain insights into valuable features and areas for improvement. Build products people can't live without by knowing exactly what they need.
- Customer Retention (Friends Forever): Identify factors contributing to customer loyalty, address pain points, and reinforce positive experiences for enhanced customer retention.
Why you should follow User Behavior Analytics best practices? Conclusion
Analyzing your user's behavior isn't just an option; it's a strategic imperative for any successful business. Guide to User Behavior Analysis serves as your compass, helping you navigate through user needs and preferences to create standout digital experiences.
Thinking about giving UBA a go?
When it comes to analyzing data for websites and online products, there are many tools out there to make things easier. These tools automate tasks like collecting and organizing data, allowing you to focus on understanding the results. One such tool is cux.io.
By leveraging available solutions, you don't have to bother with manual data collection, grouping, and analysis. Modern tools for qualitative analytics, like cux.io, bring significant simplifications to understanding online behaviors. They are designed to demystify the analytical process, making it more accessible to a wide range of users. As a result, even individuals without deep technical knowledge can fully harness the potential of qualitative analytics, swiftly identifying and responding to user needs. This not only makes the analysis process more efficient but also more intuitive.
Get in touch to discover how our analytics can boost your business with insights you can't get anywhere else. Let's make your digital strategy shine with the power of User Behavior Analysis. Connect with us for a chat and see where CUX can take you!