August 21, 2025
9 min read
The magic of web tracking tools – which one is the best for your company? [FREE GUIDE]
In today's digital age, having an online presence is crucial for any business looking to thrive in the competitive marketplace. However, it's not enough to simply have a website.

Natalia Nowak
Business Administration & Data Analytics Student | Intern at cux.io

Importance of Web Traffic Analysis and Monitoring
Website stats are an essential part of finding invaluable insights into how your site is performing and where to focus your efforts for improvement. No matter how big the site or how much traffic it generates, it will always require periodic auditing. There are several powerful metrics to pay attention to, so it is important to know how to choose the one that best suits your needs.
Website tracking
Website tracking, also known as web tracking, is the process of monitoring and analyzing user activity on a website. It involves collecting data about website visitors, such as their browsing behavior, location, device type, and using this information to gain insights into how they interact with the site. Then, using this information combined with qualitative analytics, you can look into the user behavior analytics – the "why" behind all actions.
![]()
User behavior analytics
Tracking user behavior allows understanding how users interact with and perceive a website or digital product. By tracking interactions with the website (such as rage clicks, page refreshments, excessive zooming), you can find user’s frustrations – so-called “pain points”, spot conversion drops, measure engagement metrics, as well as implement quick wins. Moreover, it contributes to easier and more precise personalization by creating very accurate customer segments.
Website traffic
In simple words, traffic analysis is the process of measuring the number and type of visitors on a website. It collects traffic data about their location, the pages they visit, referral traffic (where are the visitors coming from), and the amount of time they spend on the site. By utilizing website traffic statistics, you can gain insights into the effectiveness of the marketing efforts, the popularity of the content, and the user experience of your site.
Tracking tools
Now you know what type of results you need to truly understand your customers. The next question is: HOW to get them? Depending on which web analytics tool you choose to work with, you will have access to different features and measures. Here are three tools we compare:
- Google Analytics
- Mixpanel
- CUX
Google Analytics
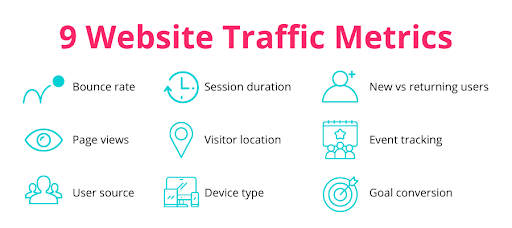
Google Analytics is one of the most popular web analytics tools that track and analyze website traffic data and user behaviors. It takes various user actions and provides statistics such as:
- page views,
- bounce rate,
- session duration,
- pages visited per session,
- conversion rate,
- user demographics.
Unfortunately, Google Analytics only measures quantitative data, not qualitative. It means that you will learn WHAT your users are doing on your website, but it will not give you insights into WHY users behave this way. Therefore, if you use Google Analytics by itself, it might be difficult to identify what frustrates your users, find their pain points, or to stop missed opportunities.
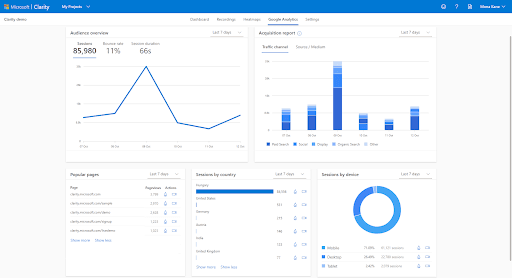
Source: Microsoft Learn
Mixpanel
Mixpanel is another online tool that helps companies with website analytics. It provides similar insights to Google Analytics, however, it gives more detailed information about funnels, segmentation, user paths, and product impact.
Surprisingly, the biggest downside of Mixpanel is the difficulty of using it. Users often complain about the struggles in figuring out how to use its features and the platform itself. Moreover, because of lack of automation and difficult customization, it might be necessary to use engineering efforts to track user behavior in detail.
![]()
Source: Mixpanel
cux.io
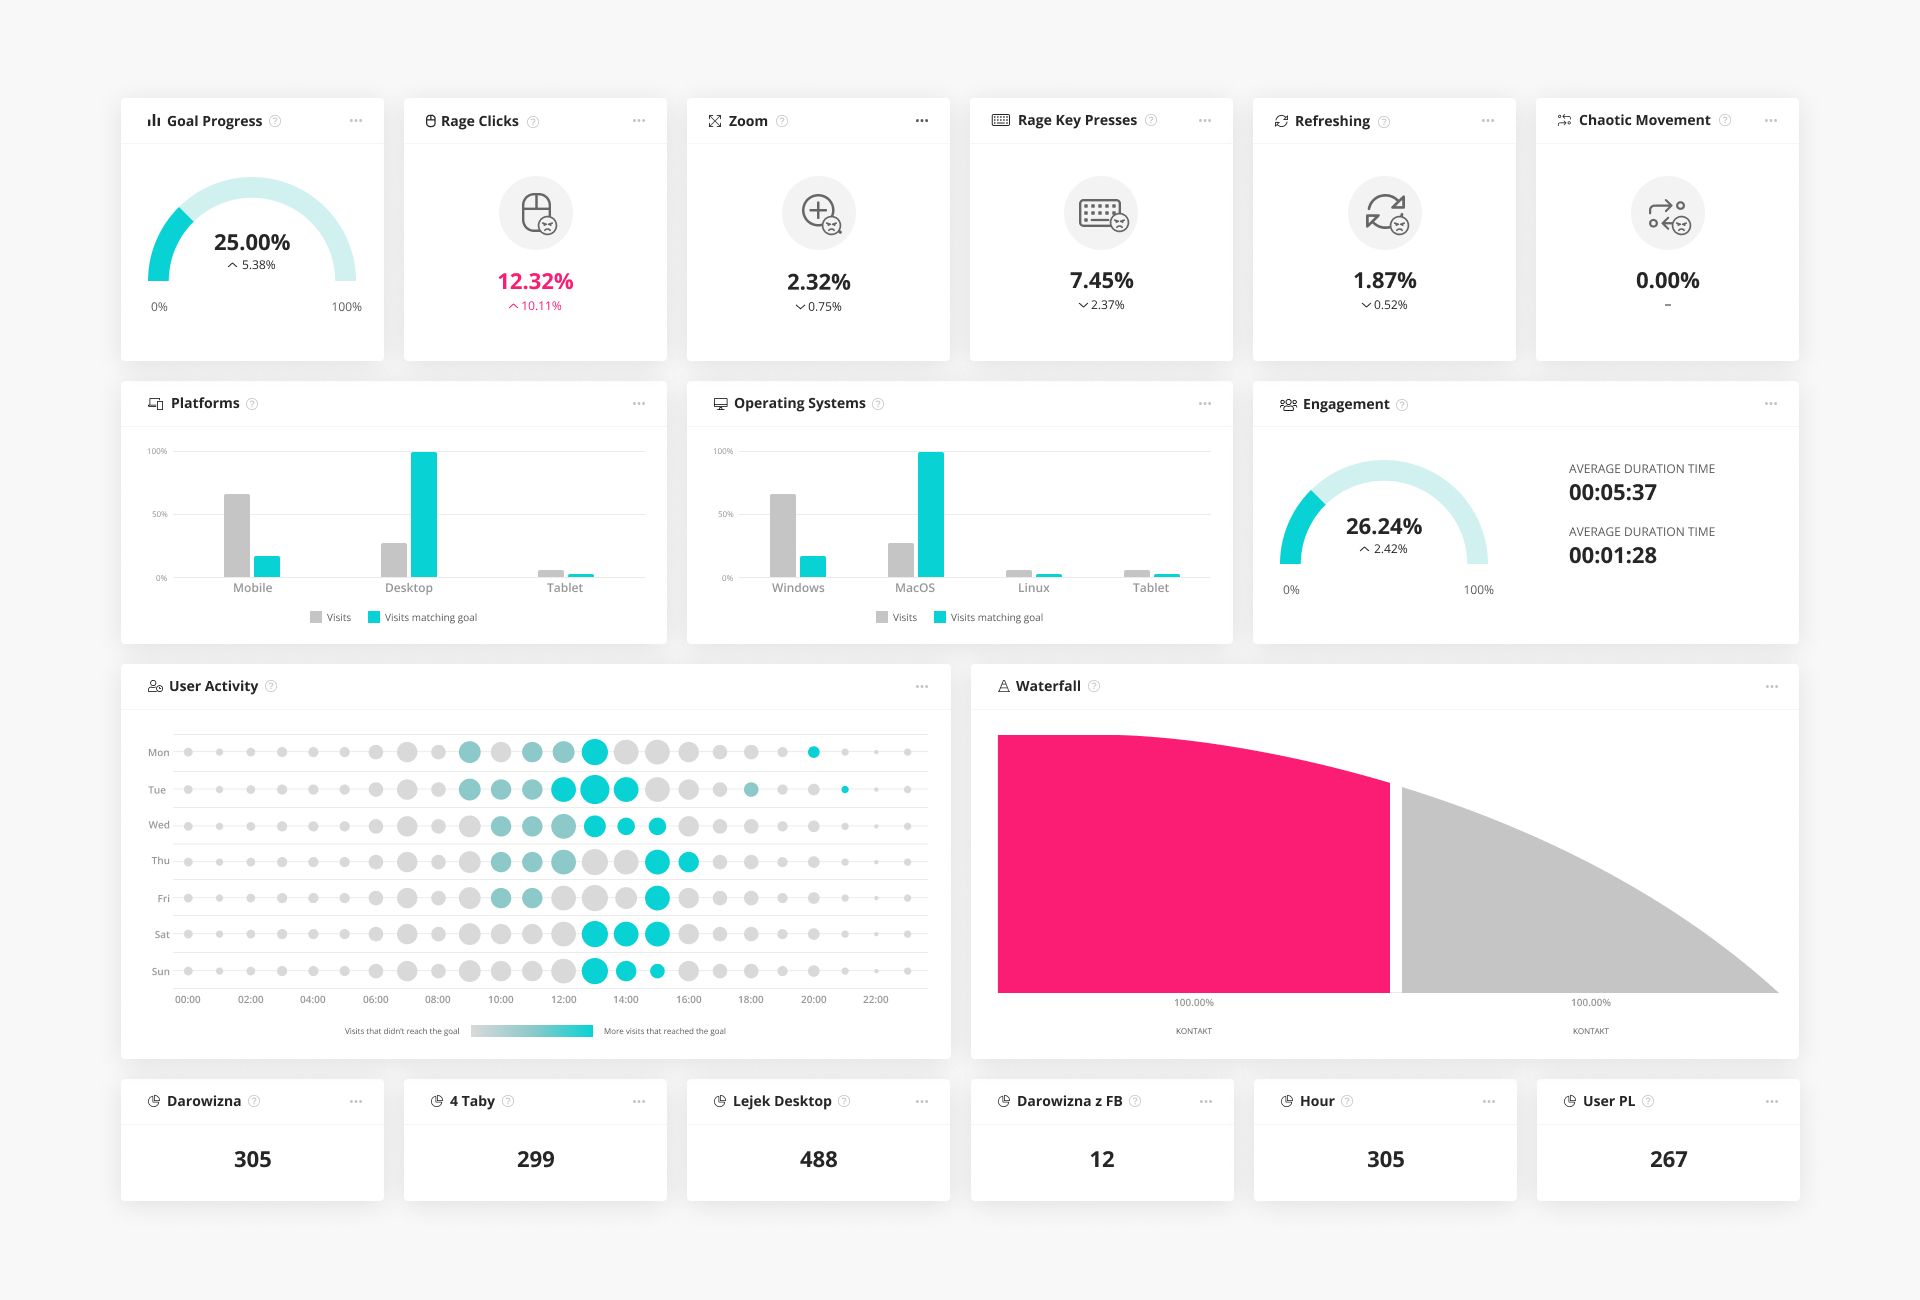
CUX is the first-ever UX & Analytics Automation Tool that eliminates sales inhibits in digital products – especially e-commerce. It specializes in detailed analysis of user behavior, with the focus on combining quantitative and qualitative analysis. While other tools usually focus only on the first one, CUX also gives insights into WHY customers behave the way they do. Some of the advantages of using CUX include:
- easy set-up and maintenance, without the need for engineering knowledge,
- goal-oriented analysis to minimize the data SPAM (CUX collects only the relevant data for your company),
- detailed user-behavior analysis that allows to efficiently find pain-points, quick wins, missed opportunities, detailed customer profiles and customer journey map,
- features such as: visit recordings, heatmaps, conversion waterfalls and more.
Free website traffic checker tool
If you are just starting with web analytics, you might be looking for a free tool to help understand your traffic data. Unfortunately, the features of most free traffic stats tools are quite limited. Therefore, it might be more beneficial to try a free version of a paid software to choose the one that fits your needs the most before you make the purchase.
However, if you only need to gain basic insights about the website, or you would like to check competitor website traffic, you can use resources such as Semrush. With the free version (no need to sign up), you can immediately see basic information about any website's traffic data, such as:
- how many visitors it has,
- the global, country, and category ranks,
- average time spend on the website,
- number of pages per visit,
- bounce rate,
- traffic by country and device,
- website traffic journey,
- paid vs organic search traffic.
![]()
Source: Semrush
This information can give you an idea about website traffic estimates yours or your competitor sites are gaining. However, it doesn't allow you to download a traffic report, so you must enter each website manually, which may be time-consuming. This information by itself is very basic and definitely not enough to base any digital marketing strategy on, but it might be a good start in learning about the magic of web analytics.
What should I look for in website statistics tools?
As we mentioned, there are various online tools available for you to implement website statistics, and each of them has slightly different features and methods of collecting data. So which one is the best for improving website performance? Here are a few unique features that you should look out for when choosing your tool.
Visit recordings
Visit recordings are replays of visitor's sessions on your website. You will be able to see and follow all of their actions – such as clicks, mouse movements, scrolling, zooming. However, it is important to remember that most tools such as Google Analytics only allow seeing one session at a time, not a visit. It means that instead of focusing on the whole time they spend on the website, you will be able to only see fragments where a user is actively engaging with the site. Usually, after 30 minutes of inactivity, the session expires.
This might create some bias – imagine if in the middle of online shopping you decide to walk your dog. When you come back home, you continue shopping and make a purchase. However, in the eyes of the software, your first session on the website was "unsuccessful", because you didn't finish the purchase. This might create bias in the conversion rates.
One of the tools that measures the whole visit (from the moment you enter the website to the moment you close it) is CUX. It also shows the recordings regardless of how many tabs they open and for how long.
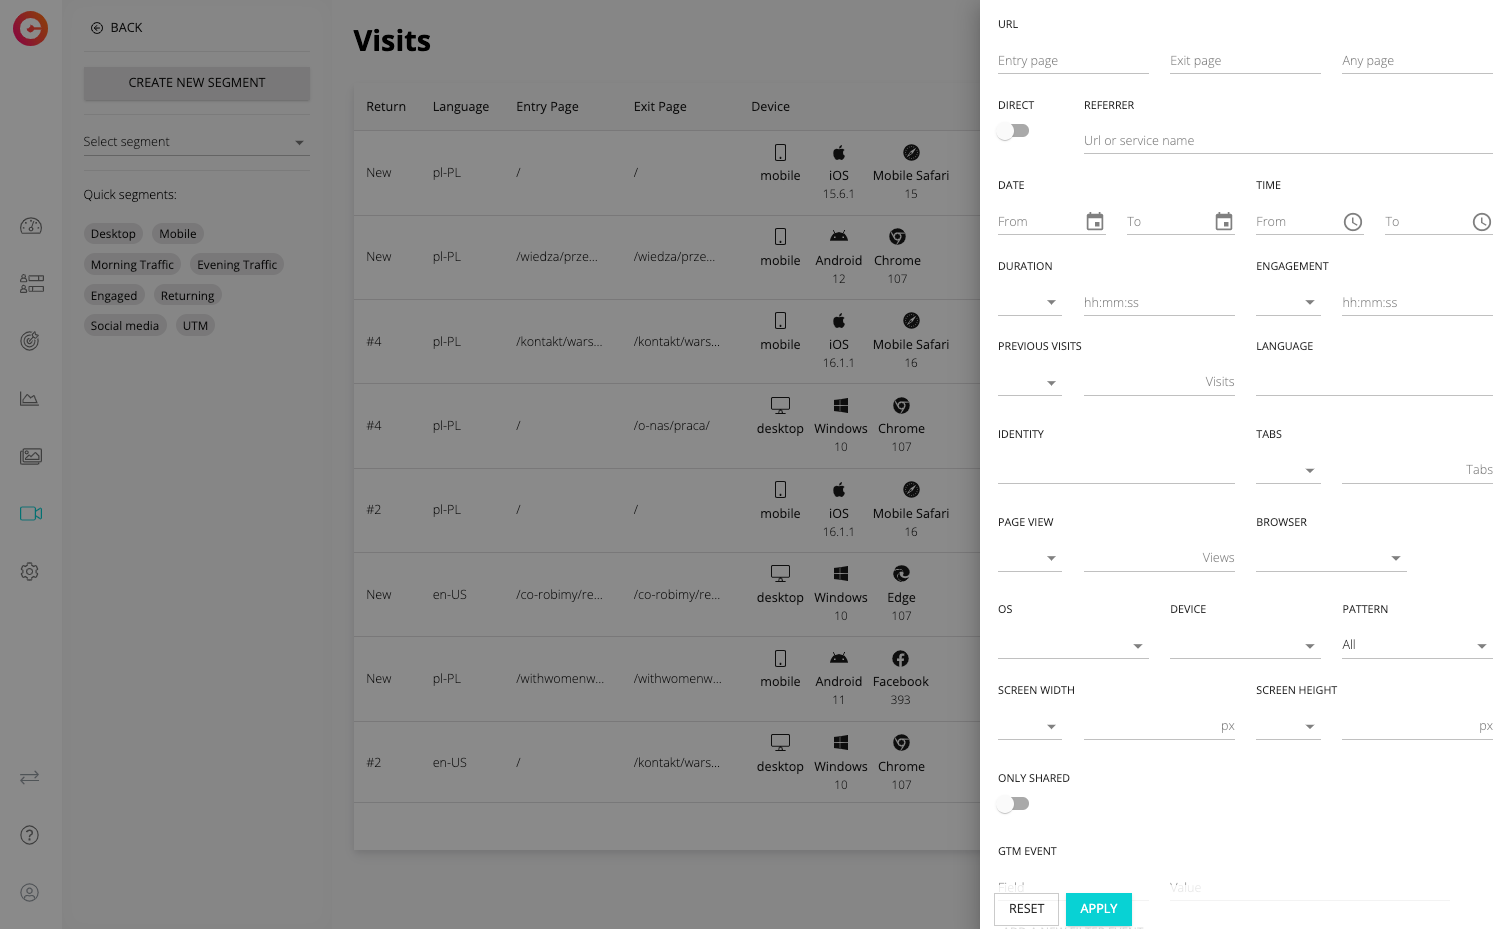
Visit recordings as cux.io show whole visits, regardless of how many tabs they open and for how long.
Heatmaps/Link maps/Scroll maps
Heatmaps are a graphic representation of where on the website users are the most active. It shows "hot places" based on your chosen metric, such as clicks.
Link maps seem similar, however, they only take into consideration clickable elements (such as CTA buttons or menu tabs). They ignore all actions that take place outside of these elements.
Scroll maps show how far your visitors are willing to scroll down the page to find what they are looking for. It is especially useful for long pieces, such as articles.
When choosing your tool, it is important to make sure what kind of map it uses. Often the feature in the software is called "Heatmap", when in reality it only measures clickable elements, and therefore is a link map.
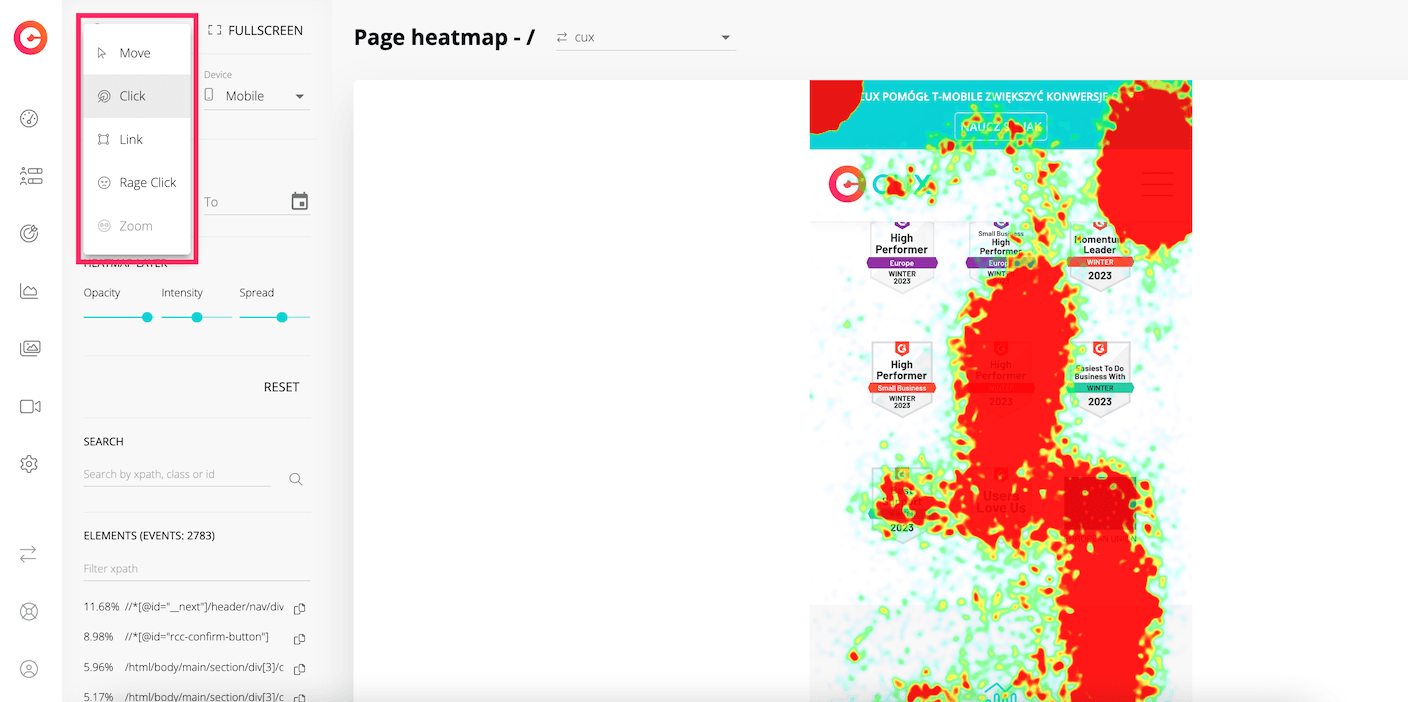
CUX offers both heatmaps and link maps, all in one place.
Goal-oriented analytics
Choosing the right goals lets you focus only on the data relevant to your business. The goal could be predefined, or input manually. Some of the most popular ones are: purchase, form submission, file download, or registration. Thanks to this, you avoid data SPAM, and focus on engagement that is crucial for your website.
Conversion Waterfall
Waterfalls are a visualization feature that allows to track and analyze the conversion process of a user or customer through a sales funnel. It represents the progression of a user from the initial interaction with a website or landing page to the ultimate goal of converting into a paying customer, or another event that you choose as your goal. It typically includes several stages, such as impressions, clicks, visits, leads, and sales. The overall goal is to increase the conversion rate, and optimize the user experience.
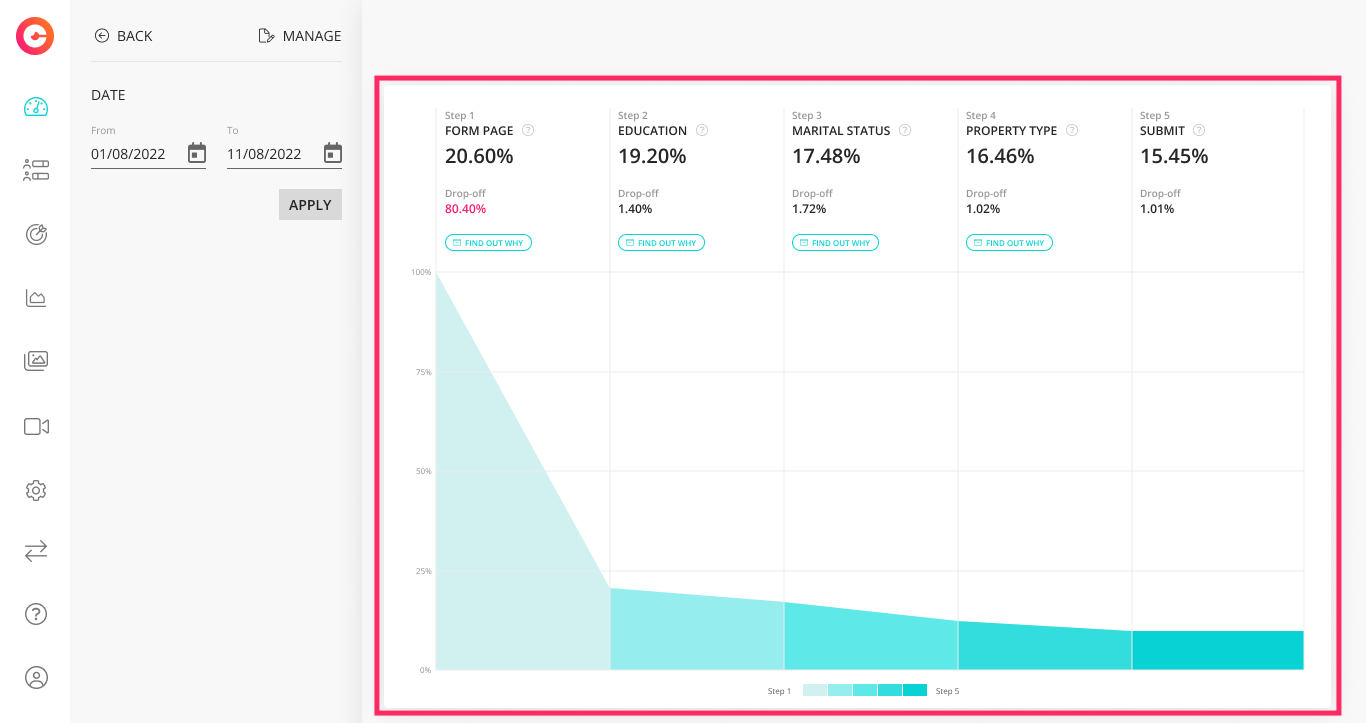
CUX automatically captures events on your website and allows you to see Visit Recordings connected with each stage.
Final thoughts
Choosing the right tool for web tracking is not an easy task. The type of valuable insights you should aim at vary depending on what are your goals and things to improve. You should compare the features that each of the tools have, and what data driven decisions you can make with these results. One thing is for sure – today, website analytics is an absolute necessity for any competitive brand. Don't miss out on your opportunity to shine!