October 21, 2025
8 min read
What can the customer journey tell us about condition of website?
What exactly is a customer journey? What does it usually look like, and what can it tell you about your site condition? Can user behavior analysis be used to improve and map customer journeys?

Kamila Kotowska
Head of Growth at cux.io

What is customer journey on website?

A customer journey map is a visual representation of your users' actions. It contains every single interaction with your site. You'll see traffic sources, clicks on buttons, exit pages, and conversion progress. You name it!
What's more important, a customer journey analytics software lets you track and analyze your users' behaviors and experiences. It's also a great way of spotting any implementation issues, technical bugs on your website, and finding customers' pain points, which often signal user frustration. Read also: Optimize customer journey
_
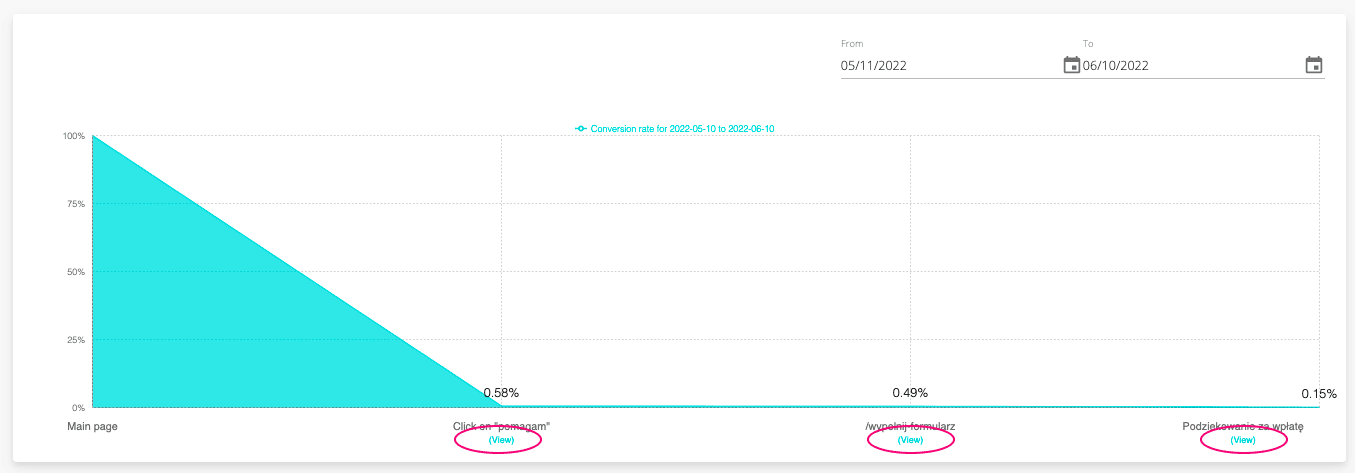
Learn about condition of your site with Conversion WaterfallsWhat does a customer journey map tell me?
You may wonder what is the purpose of documenting a customer journey? Well, if you'll do it right and combine it with behavioral analysis, you'd be able to find optimization quick wins in just minutes! The process of mapping frustration on the customer journey can help you with that.
With a customer journey map, you can better understand the customer, actions thoughts, and emotions. You will be able to get to know your customer's perspective and point of view.
Diagnosing website health through customer journey analysis
Keep in mind that users may not experience your site exactly the way you'd want them to. There are several indicators of their frustrations. They are most commonly the outcomes of bugs, errors, or design imperfections. The good news is that you can easily spot customer pain points with Experience Metrics.
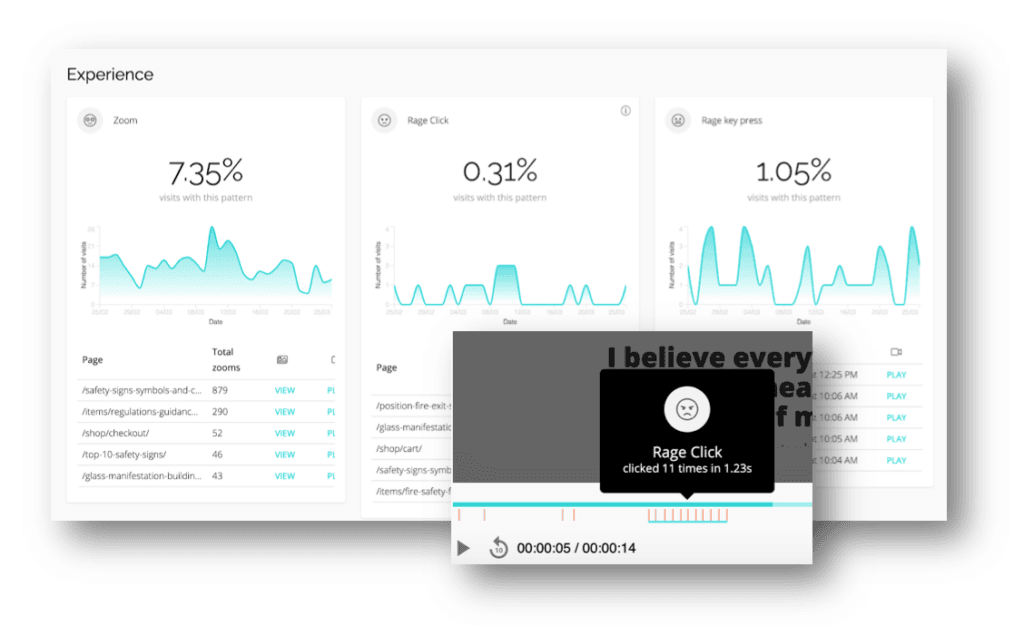
Experience Metrics gives you insights into users’ experiences and interactions with your site
Spotting common user frustration points on the journey map
Readability issues (indicated by excessive zooming)
This is one of the most common pain point that affect the condition of the site. On mobiles, users tend to zoom their view to get a closer look whenever text or image is too small or unreadable. So, if you'll see lots of zooming on your users' customer journeys, check if your page elements are accessible enough!
Confusing design & navigation (indicated by chaotic movement)
It's a well-known fact that users make a lot of movements during a website visit. You can track their experiences with customer journey mapping. Also, you can spot specific places that cause them confusion. The lost user will move the cursor in a very chaotic way – scrolling up-down-up-down, or in various directions without any logical goal. If you'll see chaotic movement metrics on your customers' journey impacting the conversion path – that's a sign of a need for optimization!
Bugs & errors (indicated by rage clicks)
Rage clicks are not necessarily a bad sign. Sure, you don't want your users to get frustrated. You want them to happily forge ahead to conversion. BUT rage clicks are a great way to spot implementation errors and bugs on site. Watching a customer journey that shines with rage like a Christmas tree can indicate places on the site that need your immediate attention. After all, users' actions are just a reflection of their experiences.
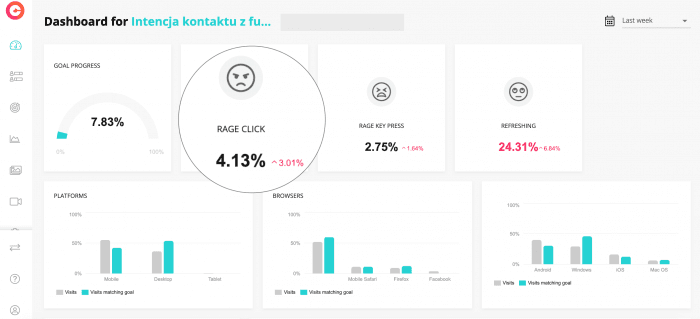
CUX lets you track Experience Metrics on customer journeys pre-selected in the context of your most important business goal
Dead and broken links
Heatmaps and link maps are a go-to tool for the mapping of customer journeys. Comparing experiences on both can give you a painless discovery of dead and broken links on your site. How? Since heatmap represents ALL user actions on your website, and link map focuses ONLY on clicks on clickable elements. If you'll be able to spot clicks and movements on heatmaps, and no action on the link map – there's a broken link for you to fix!
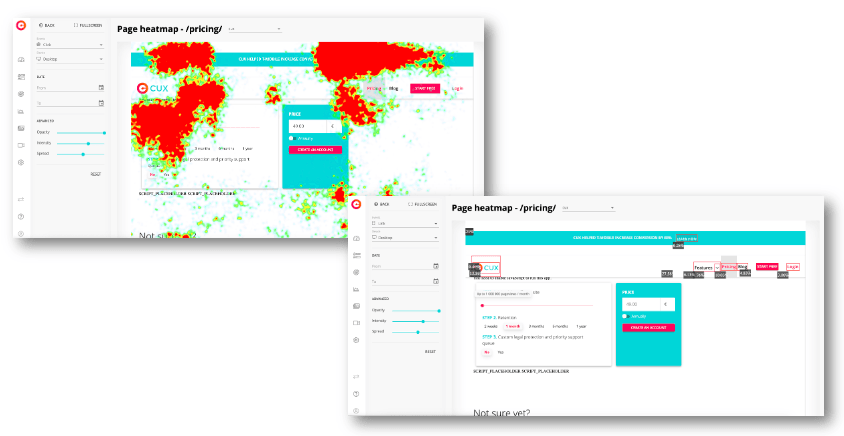
Comparing heatmaps with link maps lets you find click-opportunities or dead links.
Page load & display problems (indicated by refreshing)
It's seen both on mobiles and desktops (and even on smart TVs if you're using CUX to track your users' behaviors). Frequent refreshing can be a sign of display problems on your site. Whether it's some page elements that haven’t loaded correctly (or at all) or some features that hadn’t been displayed – you'll see it on the customer journey. Experience Metrics may even show you the misplaced or misaligned parts of the page breaking the intended user flow.
Broken images or graphics (indicated by zooming/errors)
If there are any design issues on your sites or within your products – you'll see them by tracking zooming. If photos or graphics are not loading correctly, you can bet your life that it'll be reflected in the customer journey. By analyzing users' behaviors with Experience Metrics, you'll get full access to any indication of graphical errors.
If you want to know more about common UX mistakes on websites, where you can find them, and how to get rid of them., you should read this article.
How to create a customer journey map?
As you already know, a customer journey map is a whole picture of customer touchpoints. It contains crucial information about the customer experience of your business for the sales and marketing department.
Customer journey maps shows how customers are interacting with your company, what is their CX and how they go through the sales funnel. By maximizing and improving the efficiency of the entire customer journey, your sales, and business goals will also improve.
You are probably wondering how to create a customer journey map, or are there any customer journey map templates on the internet?
Every customer journey map will be different for each business, or even it will change for every customer persona. A customer journey map can be created by yourself on templates that you can find in google search (but you must be aware of that, this will be time-consuming). Or you can skip to the easier way and use customer journey mapping tools.

Customer journey map template
Customer journey map might take various forms, through the internet, starting from PowerPoint templates through basic PDFs or colorful infographics!
A good practice is to look for the best one that will suit to your needs. The customer journey map template can help you with:
- finding actual places for quick wins and conversion improvements
- refining customer personas, according to customer journeys and in terms of their behavior
- getting better knowledge of emotions of your customers and how they interact with your business,
- releasing a new product or service to the market with planning ways to reach the customer,
- developing post purchase path and increasing customer retention
Below you can find an example of customer journey map template prepared by Custellence.
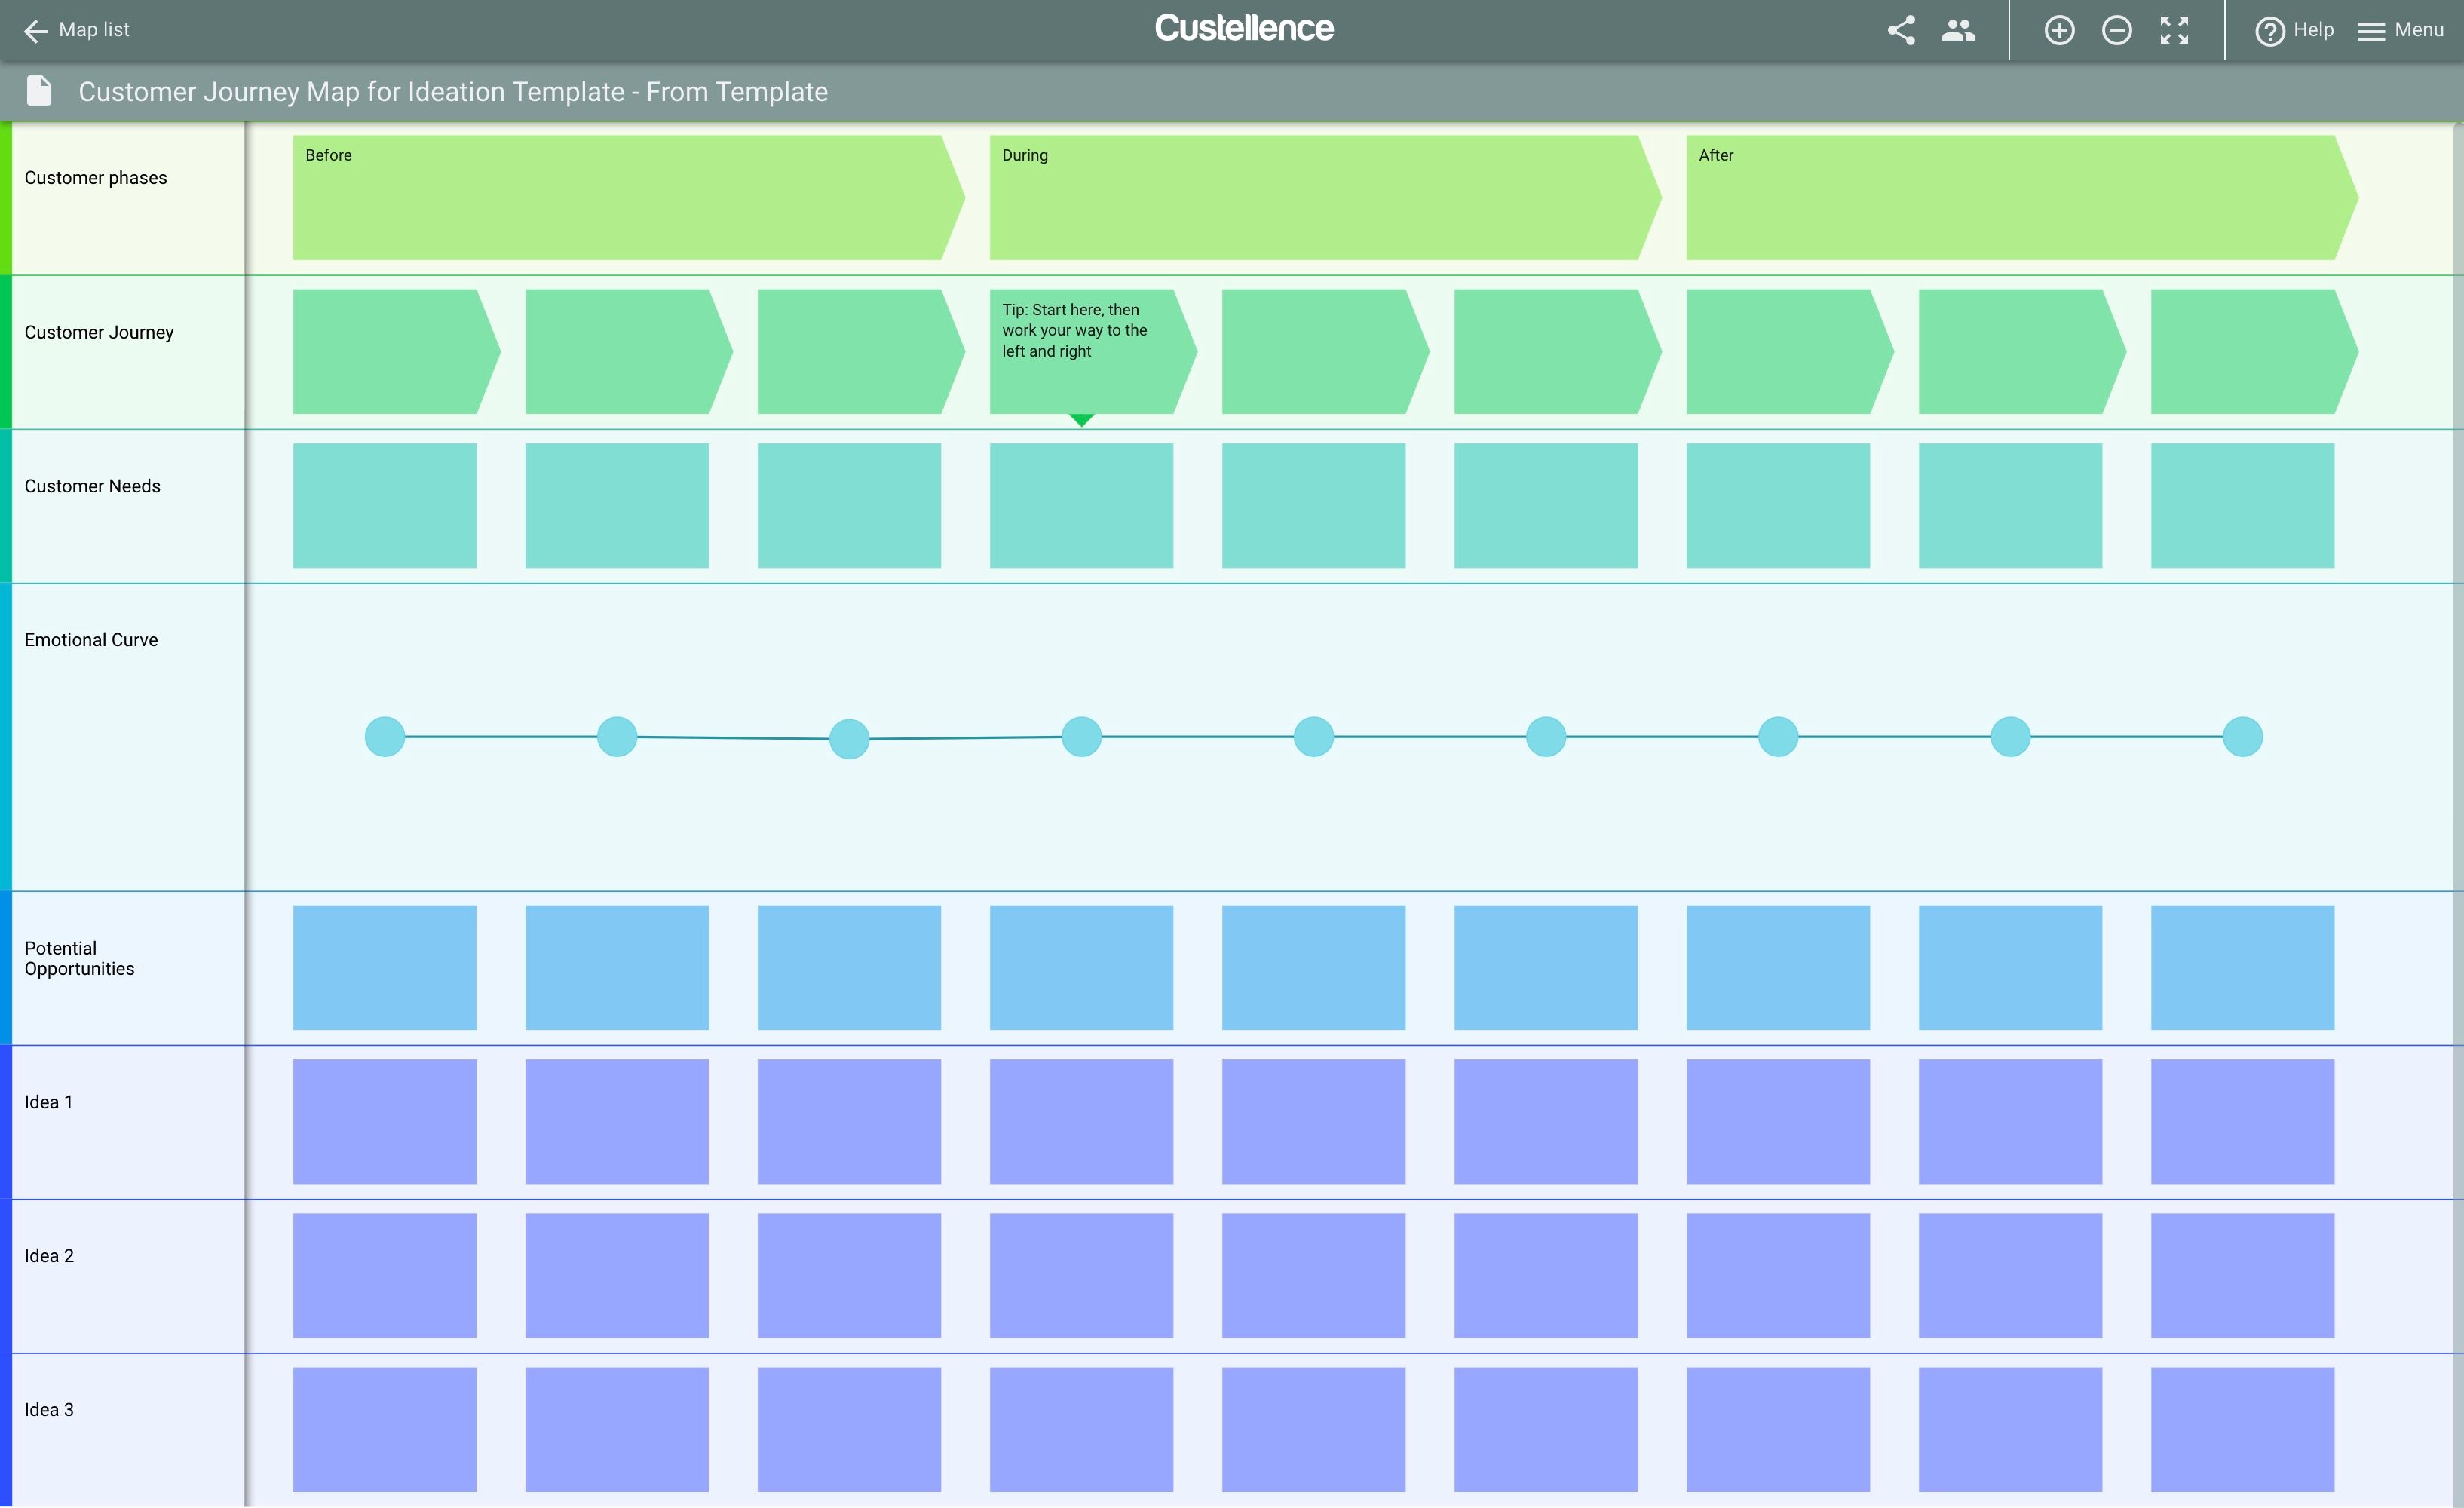
Source: https://custellence.com/
Customer journey mapping tools
There are numerous tools available on the market that will help you map the customer journey. Whether you want to see the flow on a diagram or a chart, spot conversion drops with arrows or numbers, or just track users' behaviors – there is a great range of possibilities.
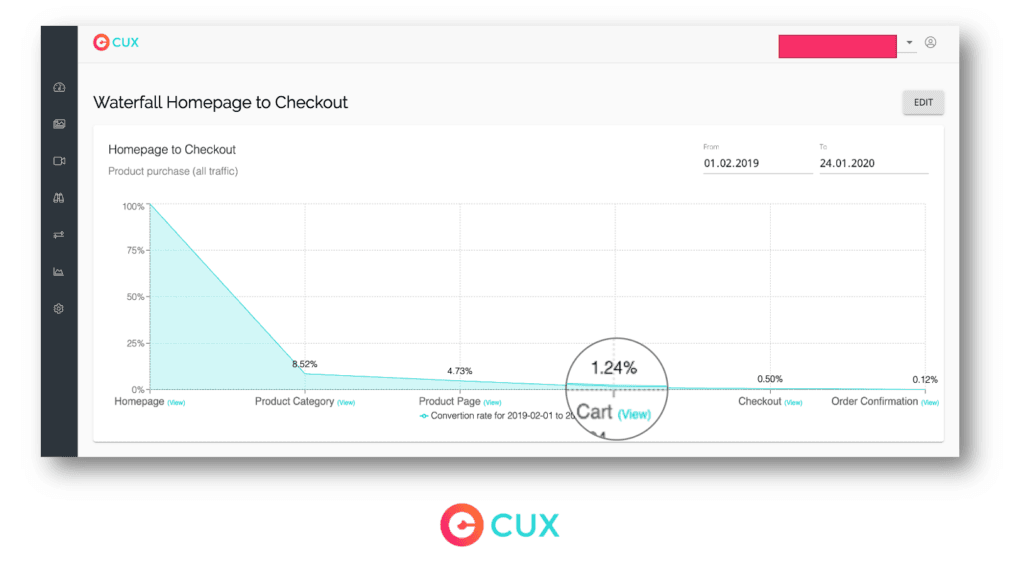
CUX's Conversion Waterfalls represent your customer journey maps. They consist of steps that mirror your user actions on the site. Conversion Waterfalls helps you track visitor behavior in various scenarios, like form submissions, check-out process, account registration, etc. by collecting customer data.
 _
_
Most important benefits?
- Auto-captured events. CUX automatically captures events on the website, so you can codelessly track every step of the user journey.
- Goal-oriented evaluations. Focus exclusively on the most informative types of data that we'll pre-select for you.
- Visit recordings. Easily find reasons for the conversion drops and missed opportunities for its increase.
- Retractive analysis. Map any customer journey using historical data.
- All-device observation. Gain access to journeys from all device types.
Google Analytics
As a traffic analytics tool, Google Analytics lets you measure your website traffic metrics. You can easily spot things like bounce and exit rates, sources of traffic, goal conversions, and user demographics.
GA is not a traditional customer journey mapping tool, but it'll help you identify a lot of insights on your buyer personas.
TIP: Combining qualitative and quantitative analytics tools can take your business to another level. See how to integrate CUX with Google Analytics.
Heap
Heap is a great tool for looking for users' pain points, increasing retention, and reducing churn rates. As a no-code analytics tool, it grants you access to knowledge about customer segments, that you can easily use to create a customer journey.
See our article about customer journey map tool, Heap. Is it a good tool, and what does it provide (or not), if you want to learn more about it.
Hotjar
You can easily track users' behaviors with Hotjar's heatmaps and recordings. You can also use more research-like features like survey templates or analyzing customer satisfaction or feedback.
MIRO
MIRO, as an online whiteboard, might be a surprise, but it's one of the essentials for teams working remotely. It enables you to create – from scratch or using ready-made templates – a visual representation of your customers' journeys. Also, MIRO is easily integrable with various analytical tools.
The effective customer journey map
So put your customer's shoes on and begin a beautiful process of creating a customer journey map and understanding the customer!
But remember! At the end of the day, no matter how effective a customer journey map you will create with all those colors tabs, and charts. Without proper behavioral analytics and implementing quick wins related to your business goals, you won't conquer the world.