Case Study
21.06.2021
5 minutes read
Shorten the user journey - Quick Wins #4 [FREE UX CASE STUDIES E-BOOK]
We often come across a situation where the original conclusions drawn from the data are completely irrelevant to the reality of the user journey.


List of Contents
We often come across a situation where the original conclusions drawn from the data are completely irrelevant to the reality of the user journey. How much time and – very often – money you’d be able to save by observing the users’ behavior behind these sad numbers. And how much fun it would be to implement the quick wins and watch them numbers grow!
High traffic, low conversion problem
In today’s Quick Wins series, we present to you the case study of our footwear industry client. The well-known e-commerce with branded shoes at approachable prices came to us with a problem. Despite satisfactory traffic, their conversion rate remained at an alarmingly low level. To save the day, they’ve decided to start investing in abandoned carts, rather than user journey analysis. Reason? They heard on many webinars and conferences – it works! They came to CUX with their own conclusions, looking only for confirmation before moving to spending money on campaigns:
- People do not buy on mobile. They prefer to finish the purchasing process on the desktop and that’s just the way it is.
- Multivendor marketplaces (of which they have 90% of traffic) do not sell.
- We should invest in abandoned carts or invest in a new paid campaign, because the current activities didn’t work.
What’s worth mentioning is that when it comes to numbers, everything (except for the conversion, duh) seemed correct. Traffic was satisfactory even with the high bounce rate – but it rather raised a warning instead of a red flag. After preliminary interviews and basic analyzes, it also turned out that 55% of their users came from mobile. 90% of visits came from marketplaces, which they blamed for inhibiting sales. The main problem indicated by the numbers was a very low – even negligible – conversion from mobile.

In addition, the conversion funnel of user journey set up by e-commerce showed that users enter and view the product page (as it turned out later, not necessarily the product itself) and exit. They did not add the product to the cart, they did not proceed to the purchase.
Watch user journey, not just imagine it
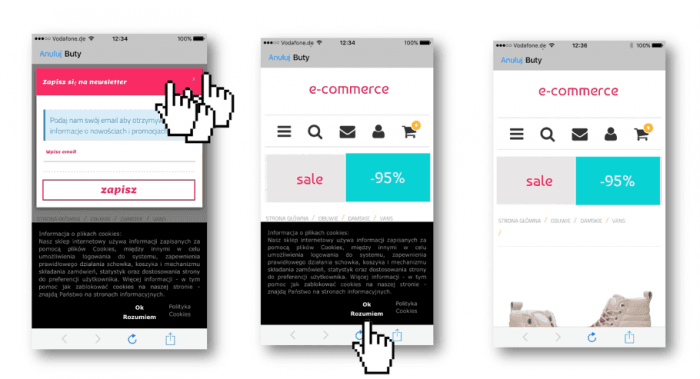
And here is where the real adventure in searching for answers to analytical questions began! After connecting the client’s website to the tool and focusing only on traffic coming from mobile, it turned out that as many as 25% of users zoom in on the content. That was our first warning! The very first users’ visits recordings have already shown that people waste a lot of time before actually seeing the product. They were distracted, among other things, by annoying pop-ups. In many cases it took up to 1 minute to get to the “buy” button!!
Analyzing the events that the user had to perform to complete the purchase, we saw a very complicated path. Instead of an intuitive
product -> add to cart -> buy
we got a complicated and multi-step waterfall
product -> close cookies -> close newsletter -> scroll about 300px banner with a great discount and special promotion -> add to cart -> buy
Thanks to the recordings, we saw that not everyone closed both pop-ups. Some closed only one and tried to scroll further, which made it even longer to get to the CTA (if they’ve reached it at all)! We also saw that the button to close the newsletter sign-up window was too small. It caused mobile phone users to repeatedly click around the button, zoomed in and – worst of all – get extremely frustrated.
Quick win
Shorten the user journey
In situations like this, you need to remember the basic truth: users who come to your site from the marketplace have already gone through one path entitled “find your dream sneakers”. At this stage, they are not interested in loyalty cards, newsletter subscriptions, satisfaction surveys and blog entries, but only in getting to the check out with their perfect shoe.
Smart analysis of data from user behavior allowed us to find quick wins almost immediately. The client should eliminate unnecessary content for marketplace traffic, focus the user’s attention only on the purchase and, above all, shorten the user journey. To sum up, instead of spending a fortune on a campaign to save abandoned carts, they’ve invested in two days of designer and programmer work.
Aren’t quick wins just awesome?! 😁
_
QUICK WINS are quick solutions that immediately respond to the needs of your online consumers. Deployments do not require significant resources, implementing takes up to maximum 60 days (although it can be implemented right then and there). Quick wins are based on the constant observation of analytics metrics and customers’ behaviors. Thanks to analytics, we’re able to choose the right solutions that allow us to make business decisions based on data, and not on the intuitions or stakeholders’ wishes.
Quick wins in brief:
- do not require expenses (or generate only small costs)
- carry a low risk,
- easily accepted by business,
- recognized on the basis of data,
- results warranted,
- implemented in max. 60-90 days,
- the project team can implement them autonomously.

Want to harvest the freshest analytical crops? Sign up for the cux.io nourishing newsletter! Be careful! We may grow on you! 🥑 😉

16/04/2021
5 minutes read
Quick Wins #2 – Intuitive UX sequence [FREE UX CASE STUDIES E-BOOK]
To say that it is important to know the specifics of our target group is to say nothing. It’s the knowledge that will not only tell us how and why customers buy.
Read more
16/07/2020
5 minutes read
Visits or sessions? Where is the difference?
When analyzing a website, its users and their actions, we can look at a whole range of indicators. For example, we can analyze the number of users, CRO, sales.
Read more
3/08/2022
5 minutes read
Reasons for shopping cart abandonment – how to check what is the cause and eliminate weaknesses? [FREE GUIDE]
Did you know that as many as 70% of e-commerce shopping carts get abandoned? If you're an e-commerce entrepreneur, that's a terrifying number.
Read more