August 21, 2025
10 min read
How to unleash CUX full potential: working with Visit Recordings
Tailoring data analytics to individual projects, we offer invaluable tips and tricks to enhance user understanding and analysis.

Kamila Kotowska
Head of Growth at cux.io

Why Individual Features Are Not Enough
We have some bad news: if you want to accurately analyze your users' behavior in-depth, simply setting goals or relying on heatmaps won't be sufficient. The good news is that CUX has you covered – our Visit Recordings feature will not only solve this issue, but also take your analytical skills to the next level. As a result, you will create better designs, launch more profitable campaigns or increase sales – and enjoy all the benefits that come with it!
But first, you might ask: why are heatmaps or goals not enough? Of course, the major components of user analytics include elements such as funnels, user journeys, separate actions such as conversions or events, flows, scenarios. However, there is nothing linear or simple about them. In reality, user’s behavior is a complicated map that the analysts constantly try to crack. Because of that, it is very difficult to simply look at a heatmap or waterfall and understand everything about the interactions with the product or website. To gain real insights about WHY the users drop off and what is behind the frustrations, we need to take one step further and dig deeper by combining different features CUX is offering.
Understanding User Behavior with Heatmaps and Visit Recordings
Heatmap is a graphical representation of user interactions with the website. Each activity like a click or scroll is recorded by adding “hotness” to the map – the more red the area, the more activity is recorded.
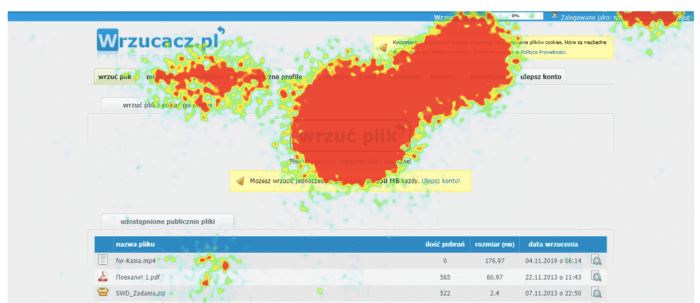
Based on the heatmap, we are able to draw initial conclusions or build hypotheses about what users like or don’t like on our website, and what causes their frustrations. However, it is not enough to base the decision to change something on the website. Before doing so, we have to find the REAL source of frustration, understand the exact interaction and its nature, as well as narrow down the area of improvement.
Finding real source of frustration
The heatmap reveals rage clicks and excessive scrolling on your website. But what does actually cause them? What is the context behind them? There are many possibilities: a simple technical issue, an annoying pop-up that is hard to close, or misinterpretation of an element as clickable when it’s not. Sometimes it’s a combination of all of them, and sometimes it’s neither – it’s just the way users interact with content (like fast clicking on navigation arrows on carousels - to quickly get to a desired piece of content). To find out which one is true, it is necessary to analyze individual visit recordings that will reveal the reason behind the red color on the heatmap. By doing so, you can precisely follow the movement and understand if they are actually frustrated and if so, what is causing it.
Understanding how users interact with the content
Another benefit of using visit recording is understanding how exactly users behave and interact on the website. If we see that a cursor activity is denser in some areas than others, it is not entirely clear why and if it’s a positive or negative outcome. However, if you utilize the recording feature, you can find out that:
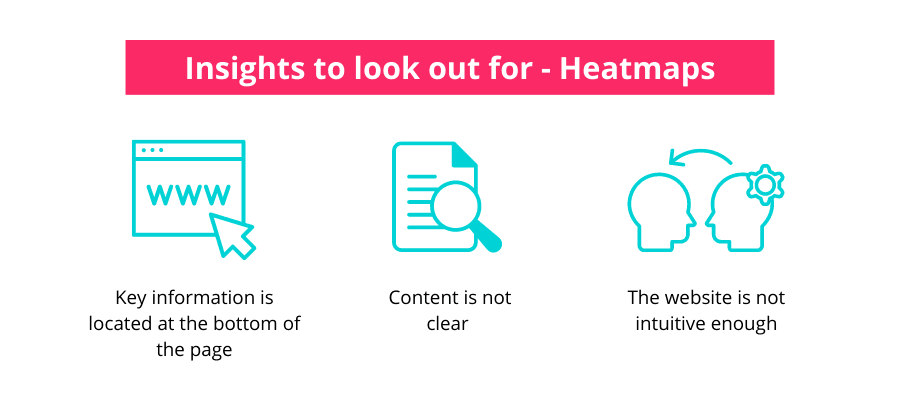
- Important content is located too low on the website – users enter the webpage but can’t see the key piece of information right away, so they quickly start to scroll down and interact mostly with the bottom part of the page.
- Content is too hard to understand – users are confused about the information they see and begin to move the mouse chaotically or highlight the text, trying to get a better understanding.
- Content is hard to find – users enter the page to find a specific piece of information, but the website is either not intuitive or the content they are looking for is hidden between the lines. Therefore, they start to continuously scroll up and down without noticeable stops in order to quickly scan the content on the screen and look for desired information.
Narrowing down the area for improvement
The key to successful UX optimization or website redesign is understanding how and in which exact moment the users perform specific actions. For example, you notice on the heatmap that users keep zooming in on the product pictures. It could indicate that there is a lack of zoom option or button on the picture, or that there is a need for more detailed pictures and product information. In some cases, the right answer will be pretty obvious. However, in other cases, you will have to narrow down your analysis and apply some additional filters like new or returning user or device. In either of the scenarios, visit recordings will help you narrow down the possibilities and indicate the specific element you should pay attention to.
Mapping User Journeys with Waterfalls and Visit Recordings
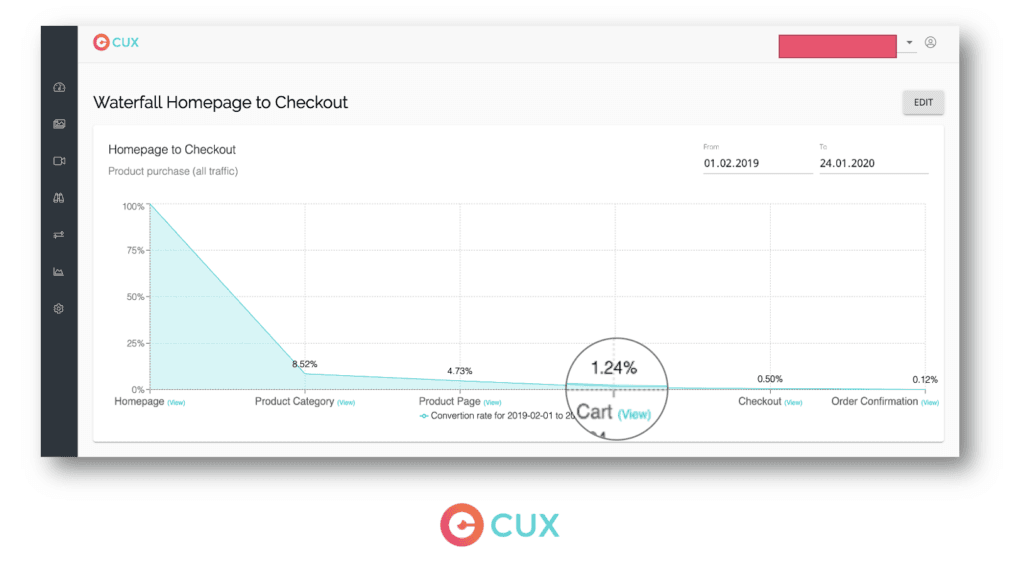
Waterfalls represent a user journey in a specific, defined order. It allows seeing which steps of the customer journey have flaws and cause drop-offs, and how many users reach the final, desired destination. These insights are definitely meaningful and provide us with great insights, but there is a way to improve this information even more with visit recordings.
Finding the real customer journeys
Often, when planning the customer journey, we have a specific idea of how the users SHOULD behave and the steps they should follow. However, it often doesn’t represent the reality – there could be a bunch of factors that will influence how exactly users get to a specific point, and it often doesn’t follow the journey we had in mind. Therefore, the first method involves switching up the order of analysis. Instead of creating the waterfall at the beginning, we instead look at the visit recordings first. Then, based on this information, we choose the goal (“destination”), and build the proper waterfalls with the steps it actually takes them to fulfill that goal. There are a few important tips to pay attention to:
- Choosing the starting point of a journey – not every purchase path starts from a homepage. Depending on the starting point, the customer journey could be longer or shorter than we anticipated. To take that into account, you should create a few waterfalls to catch the most popular paths and starting points.
- Skipping the steps – sometimes bugs or other issues may cause some steps to “disappear” from the path. It will automatically increase the drop-off on the waterfall, even though in reality some of the users might actually reach the destination successfully. For example: already logged-in users won’t see a “Log in” or “Buy as a guest” pages between cart and checkout. By analyzing the visit recordings and creating different waterfalls, we are able to escape that mistake and get the real customer journey.
- Back and forth movements – some users might need to go back and forth between the steps of their customer journey. The reason lies in the context of each situation, so the visit recordings give you an opportunity to get much more understanding of how the user path really looks like.
Discovering the reasons behind drop-offs
When building waterfalls, you can see the “Find out why” button next to each step. By clicking it, you will get access to a shortcut list of all recordings in which the users left the path at that specific point. It is a true time-saver that saves you from searching through all recordings at the same time. By using this feature, you are able to analyze all the situations, which is especially useful when you notice a sudden increase in drop-offs on a specific step, or if you’re looking for a way to optimize and improve this user path.
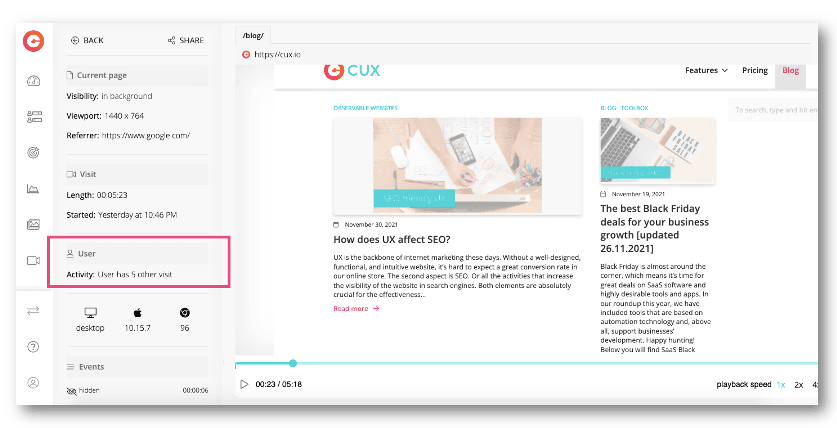
Taking more than one visit to finish the path
In some cases, you will notice that users need more than one visit to the page to complete the purchase or other goal. Thankfully, CUX is a visit-based tool – instead of analyzing the individual sessions, it takes into account the whole visit, no matter the breaks in between or the amount of tabs opened. Most of the available tools focus on the sessions, so if the user returns after some time to finish the purchase, their first session will be marked as unsuccessful and would be classified as a drop-off. This creates the wrong analogy and doesn’t represent the actual situation – maybe the user wanted to ask their friends for advice about the purchase, or simply had to leave for work. It doesn’t automatically mean that his first visit to the website was causing frustrations and drop-off. For meaningful analysis and understanding the real customer journey, pay attention to the list of other user’s visits – it may appear that some users will perform a goal on the next visit.
Leveraging Goals and Recordings
Goals give you access to not only filtered recordings by your desired event (or set of events), but also some additional data about these visits. By combining the goals and recording features, you can gain numerous meaningful insights, such as:
- Exploring your current goals – by digging deeper into the information, it might spark some interest: “why did that happen?”, or “something is not right”. This is the first step and just a couple clicks away from an answer. Almost every element on a goal page is a shortcut to a list of recordings that are already pre-filtered by given parameter and your goal. No matter if it’s rage clicks in cart, unexpected entry pages, low performance on mobile, or anything else – you have already found a convenient and simple way to analyze each visit in much more detail.
- Using goals to understand a scale of user actions – imagine that you noticed on one of the recordings that a user is struggling to finish some action, such as using a promo code. Instead of jumping to conclusions and blindly trying to fix or delete that issue, first set a goal for a corresponding action, in this case using the promo code. By doing so, you will gain access to recordings leading to this specific action. This way, we can understand the scale of the problem – is it only a case for this one user, or is it a common issue? Based on that, you can also find a true reason behind it and come up with an effective solution.
Conclusion
CUX is a very flexible tool that includes a bunch of features that can be freely combined with each other. By doing so, you are able to implore user behavior, find valuable insights, and let your business grow more than ever before. Try different combinations and discover what CUX has to offer!