User Behavior Analytics
22.01.2022
11 minutes read
How to act on UX research to improve product adoption?
Conducting UX research will provide insights that you can then use to get more customers using your product more regularly. Also, getting more value from it once they do.


List of Contents
Conducting UX research will provide insights that you can then use to get more customers using your product more regularly. Also, getting more value from it once they do. Asking the right questions of users is key. With the answers you get, it’s very easy to devise solutions and improvements and to test their effectiveness. Whether it’s quantitative behavioral data or qualitative information about how they feel and what they think.
In this article, we’ll explain how, but before that, we need to define some of the concepts involved.
What is UX research?
UX research is the study of how users interact with your website and product. From the perspective of whether they have a “good experience” (in terms of both value and enjoyment) or not. It should be carried out continuously throughout a product’s lifecycle, not just at the beginning. You will ask why?
Because UX research helps to uncover what’s relevant for users. Identify the best ways to meet their needs; put proposed improvements to the test; and enable you to model and predict user behavior. Once you have collected these insights, you can make the improvements they point to.
Types of UX research data
There are two big, overlapping fault lines running through the UX research field:
- quantitative versus qualitative research
- attitudinal versus behavioral research
Quantitative research data looks at what users do and seeks patterns in this by analyzing user activity in bulk. Your analytics software provides you with quantitative data in this way, as do closed-question surveys, micro surveys, A/B tests, etc.
Qualitative research is all about “why” users do the things they do. So while quantitative research may tell you what percentage of users who got to your checkout left without completing a transaction, qualitative research would tell you what caused them to leave.
As such, qualitative research typically involves much smaller samples: relevant methods include interviews, focus groups, surveys with open-ended questions, etc.
Attitudinal research looks at users’ attitudes towards products or brands. It can combine quantitative insights (it can be done at scale and produce numerical results) as well as qualitative (by asking questions about opinions, feelings, loyalty, etc.) – tracking where and when rage clicks occur most frequently, for example.
Finally, behavioral research is again concerned with what users do in observational studies. However, it doesn’t have to be aggregated into numerical terms. Individual use patterns observed in usability tests, for example, would be behavioral research data without being quantitative.
What is product adoption?
Product adoption takes place when a customer decides that they are going to use your product. Product adoption occurs when customers decide that they will use your product. They find that it delivers the value they were looking for. Furthermore, that they will stop looking for alternatives. So, product adoption is different from new user acquisition, which is when someone decides to give your product a try for the first time.
Product adoption matters because SaaS businesses make money through subscription revenue. The longer you retain a customer, the more money you will make. Users who have adopted your product are less likely to churn than others. Not only that, studies have shown that it is usually between 5 and 25 times more expensive to acquire new users than to keep existing ones and that increasing retention by 5% increases profit by between 25% and 95%.
How UX affects adoption at each stage of product adoption?
Product adoption doesn’t happen immediately out of anywhere. It’s a gradual process that includes several distinct stages. We’ve highlighted six – where the user’s needs, knowledge, and motivations are very different. At each touchpoint, UX affects users’ rates of progress towards adoption.
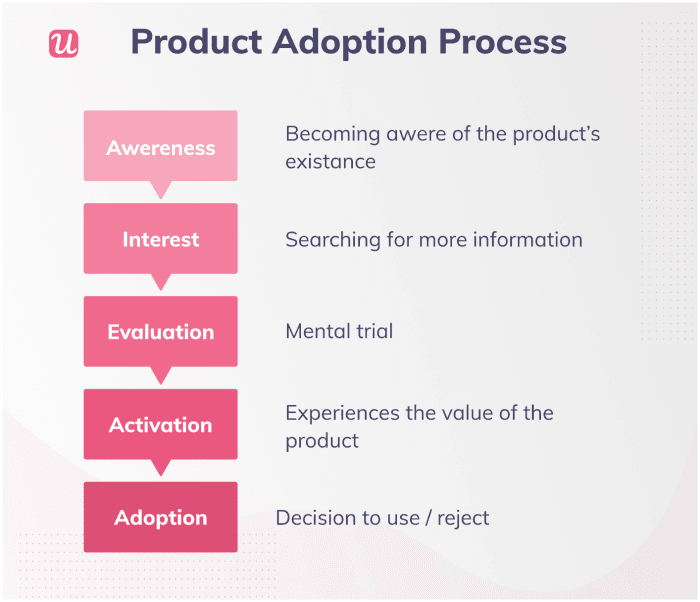
UX and Awareness
A user has to know that your product exists and what it does before anything else! The experience the audience receives when they encounter your marketing has a huge impact in getting users to the Awareness stage.
A good UX will cover making sure your product is discoverable by the right people (eg. that your website is well-optimized for relevant keywords; that the snippets that appear in search engine results pages are clear and accurate; that your ads are well-targeted; etc..). It will also ensure that visitors come away understanding the problem your product solves.
UX and Interest
The second stage is “Interest” when a potential user starts seeking information about your product for themselves. To provide a good user experience here, you need to understand what different segments of users need to know. Moreover, help them find it with as little effort as possible. Most of this will take place on your website. However, they can also be conducted through earned media and social media. It’s important to ensure that the information and experience provided are consistent, wherever it is housed.
UX and Evaluation
At the “Evaluation” stage, users are weighing up the pros and cons of giving your product a try. Again, a good UX here is all about helping users accomplish that. So, your efforts should focus on communicating the best use cases. And also highlighting your strongest features, comparisons with competitors, and minimizing the perceived costs of testing your product out.
UX and Trial
When you have convinced a user to give your product a go – at the “Trial” stage – UX becomes even more important. Difficulties in signing up for a free trial, booking a demo, or confronting the user with confusing onboarding material can undermine all the good work done at earlier stages.
UX and Activation
This stage is missed out of many descriptions of the product adoption process. Nevertheless, we think it’s an essential step. Activated users have experienced the value your product promises for the first time. This is a key milestone along the way to long-term adoption.
Your user onboarding UX needs to focus on getting users to that point as quickly as possible (minimizing the Time To First Value KPI) and with minimal friction. It’s also important that users’ expectations of value are met: if you have created expectations your product doesn’t live up to, this is where it will be exposed!
UX and Adoption
Finally! Now that a user has activated, the last stage is about convincing them that they need your product long-term. A good UX here is all about making it easy for users to realize more and more value from your product; resolving problems that they encounter quickly and smoothly; building up a relationship between users and your brand; and, on a more practical level, making it easy for users to pay.
Applying UX research findings to product adoption
So, now you’ve seen some of how UX affects product adoption rates at each of the six stages, plus how many different types of UX research there are. The next question we’ll examine is how to go about carrying out the research which will tell you how to improve adoption.
Define your UX research plan
Any research is only as good as the questions you ask, and UX research is no exception. Your first step is to determine the questions you want the research to answer. These should always be “actionable” and “specific” questions: actionable in the sense that it’s clear how to go about answering it; and specific in that you will recognize the answer when you see it. In a research plan, the questions should be broad, breaking down into different subtasks or questions.
It is also important when devising your questions to decide who the stakeholders you will need to consult with are; what budget you have available; and – in particular – what the most appropriate research methods are answering the questions you have chosen.
Map the ideal customer journey to adoption
If the research plan casts a broad eye across product adoption, the next step is to get granular. What in practice, “counts” as a user reaching one of the product adoption stage milestones? And what specific actions you should take to reach this threshold?
Work your way through your current marketing, sales, and onboarding funnels step-by-step: what will a potential customer need and feel at each touchpoint? What are the steps they need to take in each of those situations to make progress?
Once you have mapped your ideal customer journey from total unawareness to adoption. Then you can start looking into the pain points where users are diverging from their ideal journey. And also begin fixing them.
Identify the pain points that block product adoption
When your analytics software is configured to show the numbers and percentages of users who are passing each touchpoint successfully, in line with the ideal journey, you can start to see what needs to be improved. It can be very useful to use visualization software – like cux.io in the example below – to build out a dashboard showing a “conversion waterfall”.
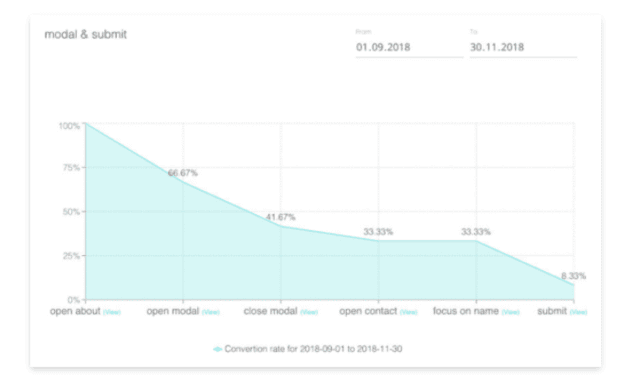
When you see a sharp drop-off, it’s a cue to dig deeper into what’s happening. You can get a lot of information with session recordings and heatmaps. Session recordings show what a single user was doing in real-time – and our version records across different tabs, to give you unparalleled insight into actual user behavior. Heatmaps aggregate this data to show patterns in where multiple users are hovering and clicking. This will give you some insight into why users are not completing the desired actions. But you can close the loop by asking the question directly. When a user abandons a task midway through, for example, use a triggered micro survey to ask why. The answers you get will build up to form an image of how you can improve the UX to improve task completion rates.
Alternatively, at the end of a workflow, you could deploy a quick NPS survey. Thanks to this you can get a more general view of user satisfaction with the task as a whole.
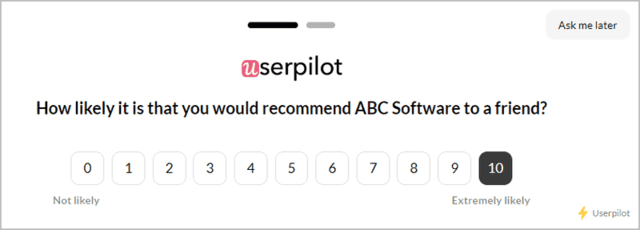
A low level of NPS satisfaction will point to a need to probe further into the details of that task workflow! But this is not the only way to approach pain points. You could equally start with qualitative questions (in a survey, for example) and look for quantitative evidence that other users are experiencing the same issues. This is a great way of discovering problems that you were not aware of, and which you may not have configured your analytics to report on.
Drive feature discovery and adoption with different UI patterns
One sure-fire way to improve product adoption is to provide more and more value to users. Using in-app prompts and experiences to drive new feature adoption is an excellent way to do this. Not only does it add value for satisfied customers, but it may also win over unconvinced users. This refers to users who have been assigned to the wrong audience segment and would benefit more from a different onboarding focus.
With an onboarding platform like Userpilot, for example, you can build out experiences that include lots of different UI elements – checklists, interactive walkthroughs, tooltips, modals, hotspots, etc. – to see which get the best user response. Alternatively, they can all be configured to be contextually triggered. Based on user segment, history, previous interactions, etc.
A/B test solutions against one another
Combining your quantitative and qualitative research, you will have come up with various hypotheses about how to improve adoption. But how will you know if your proposed solution is better than what you had before? Simple: A/B testing. Split similar users into two groups: the first group gets the old workflow; the second, the new one. Track the relative performance of each group and you’ll see which gives the better UX.
UX experiments of this kind depend on agility and responsiveness. It is important to be able to set them up and get them running fast. For that reason, it’s much better to use no-code applications for building your website, app, onboarding experiences, etc. This will allow your product team to create and run the experiments themselves, rather than waiting for developer time to write custom code.
Define the best product adoption metrics
Of course, what counts as product adoption will be specific to your product. However, there are some common metrics that most businesses use in this respect:
- Time To First Value (TTFV) – how quickly users go from trial to activation
- Customer Lifetime Value (CLV) – the average amount of revenue a user yields overall
- Product Activation Rate (PAR) – the percentage of users getting to the activation point
- Feature Adoption Rate – which as we’ve already mentioned is an excellent indicator of added value.
Conclusion
Understanding what your customers struggle with and why enables you to optimize your marketing and sales funnels, as well as your user onboarding. As we’ve shown if UX research is applied in the right way, it can be a major driver of improved product adoption. If you ignore it, you’re leaving money on the table!

Want to harvest the freshest analytical crops? Sign up for the cux.io nourishing newsletter! Be careful! We may grow on you! 🥑 😉

26/08/2019
11 minutes read
Why to improve conversion with CUX over HotJar or other alternatives?
I cannot count the times I answered this question over the last 2 years. That’s totally understandable.
Read more
25/02/2020
11 minutes read
How to monitor a campaign with CUX? The T-Mobile case
T-Mobile - as one of the largest mobile operators in Poland and the world – cannot afford a lack of media presence.
Read more
8/04/2020
11 minutes read
Does a high conversion rate always mean great customer experience?
Usually, great sales results are an opportunity to celebrate – finally, our efforts have paid off and there is nothing to worry about!
Read more