October 27, 2025
7 min read
Beyond the numbers: How to analyze qualitative data to unlock user understanding
Making the right business decisions is not always easy and can at times be a real headache. In order to make sure you do the right thing each time.

Kamil Walkowiak
Co-founder and CTO at cux.io

Standard tracking website analytics (like GA) show what users do, but adding qualitative user behavior analysis reveals why, uncovering user frustration and context crucial for meaningful optimization.
Fortunately for us, everything can be measured when it comes to online activity. These days obtaining data is neither complicated nor time-consuming, it’s relatively inexpensive, and it is available to everyone. On top of that, there is access to a really wide range of indicators on the basis of which we can verify how well our business is operating. On the other hand, you need to remember not to try to analyze everything related to your website analytics. Too much data can lead to analytical chaos which benefits no one.
What kind of data should you collect for effective website analytic?
In that case, an important question to ask yourself is – what kind of data should you collect? There is no clear answer here, because it all depends on, among other things, what business you have, what you want to research and what is the end result that you want to achieve. Thankfully, there are a few basic rules that you should follow when building your analytical empire. We will try to present them to you so that you can lay a solid foundation for this kingdom.

Collect the most basic data
There is no need to go on a wild goose chase when you’ve only just started your journey in web analytics. Rome wasn’t built in a day, and you also do not have to start with the most advanced of analytical tools. It makes absolutely no sense to start with more complicated tools and functions and lay awake at night wondering whether you indeed configured everything correctly and if all the data you need is actually being stored. What you should do is start with the basics, and when it comes to foundational tracking website analytics, Google Analytics is absolutely essential.
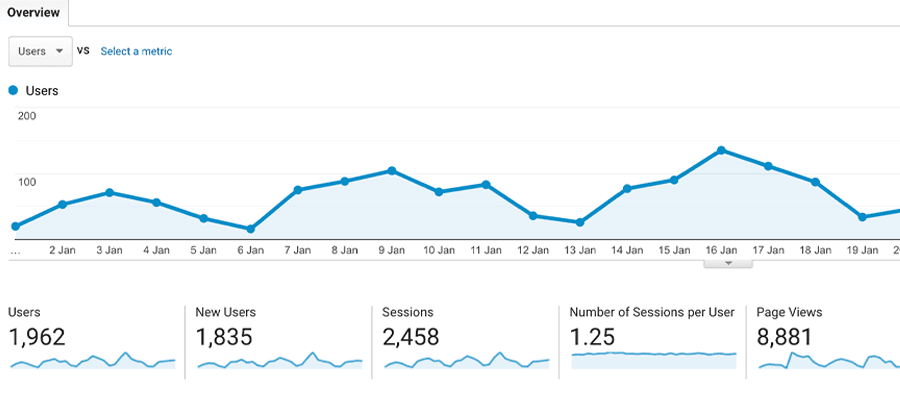
It will give you an insight into the simplest indicators that you should keep an eye on: number of users, number of page views, average time spent on it, bounce rate (i.e. the percentage of users who left the page after viewing only one tab). You will also see the demographic profile of your users or the sources of their traffic (i.e. those places on the Internet from which users came to your website). You can view the data on an hourly, daily or weekly basis.
There will be a lot of data collected, so it is important to configure GA correctly. You can do it yourself, using the advice available on the Internet, or ask a specialist for help (we recommend Maciek Lewiński!). Remember – there is no shame in asking for help. Nobody will judge you or think you are inferior in terms of knowledge or skills. Nobody is an expert in everything, and it’s important to know that there are knowledgeable people who are happy to help you configure the tool correctly.
Establish a routine: The importance of regular analysis
Data analysis should become a daily habit, just like brushing your teeth. It’s something you should start your workday with. We are not talking about spending many hours in analytical tools, sometimes a glance while drinking your morning coffee is enough to see how your business goals went the previous day, or to check if anything worrying is happening. Only thanks to a daily routine, you will be able to be efficient and react quickly to any errors that may appear on your shopping path (as was the case for T-Mobile, who, thanks to this approach, quickly eliminated the price error negatively affecting the purchasing decisions of their customers).
Quantitative analysis is not everything.
Analyze qualitative data
Once you have the correct configuration of Analytics and you visit it regularly, remember one more thing – quantitative data alone is not enough. Of course, the numbers are definitely important, they tell you a lot about how your business is going, but they won’t give you the full picture. For example, when you see a drop in sales, quantitative data tells you: hey, something’s going on, sales are falling. But it won’t give you any more information about why this is happening.
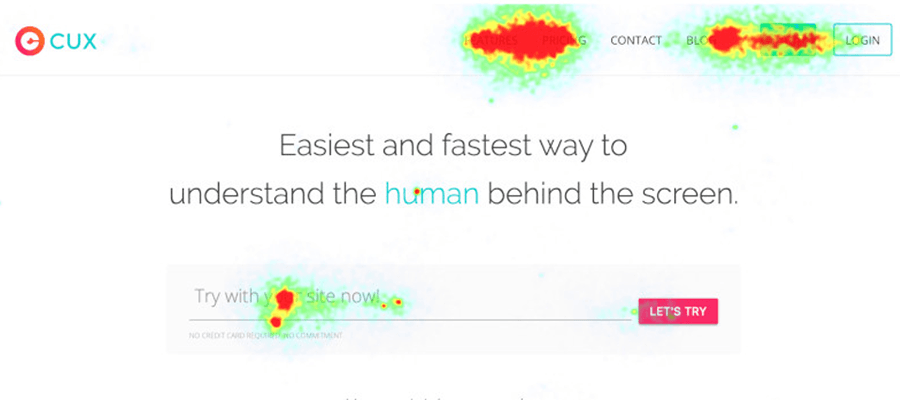
Understanding the difference, essentially qualitative vs quantitative research, is key here. To find out, you need to see what is happening on the page that makes the results drop. For this you need a qualitative insight from behavioral analytics tools (e.g. cux.io). Thanks to such a tool, you will be able to use heatmaps and recordings of users’ visits, which will allow you to see negative events on the purchasing path, which may be preventing clients to complete transactions.
Practical Example: Imagine Google Analytics shows a high bounce rate on your pricing page (Quantitative Data). You know what the problem is (people are leaving), but not why. Qualitative tools, through session recordings (user tracking), might reveal that users are repeatedly clicking on a non-interactive element expecting more info (user frustration) or scrolling frantically, unable to find a key feature comparison (poor user flow). This Qualitative Data tells you exactly what needs fixing.
Key qualitative indicators for deeper user behavior analysis
Build conversion funnels, analyze events, measure frustration
Since you already know that qualitative data is an indispensable element of website analytics, you should also know that it is worth to analyze all kinds of indicators. Start with conversion funnels. This is the basic measure that provides the most insight into your purchasing processes. It will allow you to examine each step of the purchase path and see the conversion at each stage. It will be the place that will alert you if something disturbing is happening.
Also remember to analyze all kinds of events (not just URL addresses) – scrolls, form filling, clicking on the checkboxes (e.g. when selecting consents). All this will give you an insight into whether the user interaction with the website is seamless or problematic.
Try not to also forget that, on the Internet, you can measure user’s frustration and check the level of anger based on the presence of indicators such as click reaction, content zooming or chaotic mouse movements. These measures, if they appear in the dashboards of quality tools, should be like a red light, a danger signal. These indicators mean that there is a brake in the shopping path. They may not only prevent the user from completing the purchase, but also prevent the user from returning to it due to the frustration they caused.
Holistic view: Combining analytics with brand monitoring
Use different analysis tools
If you already know quantitative and qualitative analytics, remember that it is also important to look at your internet business holistically. Try to be up to date with what people say and write about you online. It is important to be able to react quickly to any image-related crises, before they affect your sales. You want to know about both negative and positive comments about your product – the latter will allow you to build long-term relationships based on customer sentiment. To keep an eye on what is happening on the Internet, you can use tools such as Brand24 or Intercom.
Conclusion: The power of a combined quantitative & qualitative approach
As you can see, website analytics is not a piece of cake. It can be complex, complicated, sometimes even like an unsolved mystery, but if you just take a few moments and learn how to use it, it will turn out to be your best friend. Analytics will never lie to you, it will not color or beautify reality, and will always reveal the truth. Sometimes, it will be painfully honest, but it really is for your own good. Well-configured quantitative analytics, supplemented with qualitative data drawn from conversion funnels and frustration indicators, combined with information from online monitoring, will allow you to stay one step ahead of your competition, boost your sales and quickly prevent any crisis.