Conversion Optimisation
8.04.2020
7 minutes read
Does a high conversion rate always mean great customer experience?
Usually, great sales results are an opportunity to celebrate – finally, our efforts have paid off and there is nothing to worry about!


List of Contents
Usually, great sales results are an opportunity to celebrate – finally, our efforts have paid off and there is nothing to worry about! But what if this success is just the result of a temporary need or trend and doesn’t contribute to building a sustainable, long term business at all? It is much easier to build a positive relationship with customers while they are around, rather than feverishly search for solutions, once they’ve magically disappeared.
Analytics and indicators that are important for a particular business, can be a difficult and intimidating topic. This problem occurs especially when we don’t know exactly what to monitor, we have no reference point and we don’t know the market standards.
A single indicator doesn’t show the whole story
The truth is that talking about indicators with people from the industry or following reports might be a trap for your business. On the one hand, knowledge of what they look like somewhere else, will give you a broader view and references for your results. On the other hand, you should remember that sticking to these averages may not contribute to the spectacular, long-term success of your business.
Maintaining a satisfactory level of conversion may not always go hand in hand with a similar level of customer satisfaction. Customer feedback is a great example of this kind of trap. You can’t make decisions about changing the direction of development based on a single opinion.
Customer Experience
Let’s leave sales for a moment and take a closer look at customer experience
IKEA brings forward a cool example of strong customer experience alertness. A landmark analytics study for this European furniture giant, was the idea to juxtapose their sensational sales results with the actual, everyday reality of IKEA stores. Long queues, irritated, tired customers, people experiencing many unpleasant situations, those were some of your typical images in many IKEA branches. Seeing this, opened the decision makers’ eyes – these great sales results won’t actually do IKEA any good long term. IKEA doesn’t want its brand to be associated with queuing torment. Everything that IKEA stands for, as a brand, is to, not only provide people furniture and interior design accessories, but also bring joy and entertainment in their lives during a weekend trip with family. A long and arduous process of change has started at IKEA.
A big trap in analytics is excessive focus on individual indicators. We should focus instead on placing them in the context of, primarily, the behavior of our customers and users. If sales increase because of great marketing, chances are this will be temporary. Whether or not we use this situation to improve our services for the future, depends on us.
IKEA’s case is very complex. Their online sales results collide with offline observations. Fortunately, things are a bit simpler in the world of digital products. Colliding sales data with user behavior can take place naturally, step by step, with no need to create external reports. How? We will try to explain this further.
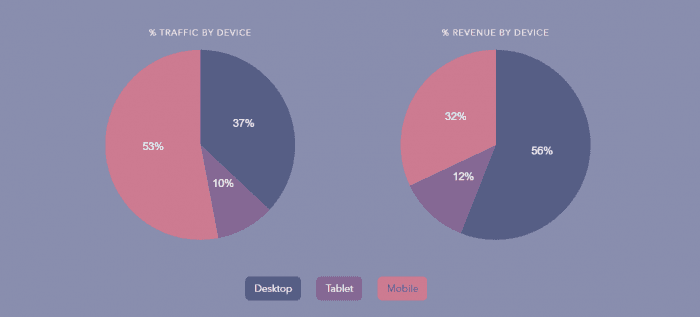
Is conversion rate lower via mobile?
We often hear that customers of various online stores don’t buy products on mobile devices; they only browse them and make the right purchases on the computer. Yes, this is happening, but not because they want to. They are simply used to do this, because websites aren’t responsive enough for mobile shopping. Surely, you’ve experienced the need to postpone shopping to when you get home, even though you wanted to buy the item then and there.
This case can also be associated with social selling in Poland. Let’s imagine that we are marketing our product on social media, maybe even in cooperation with an influencer. There is hype, the internet is buzzing about our product and our conversion is growing. Success! Our goal has been achieved.
Now, let’s reverse the situation and look closer from the user’s perspective. The user sees something he likes, feels that he wants to have it, and in addition it’s promoted by someone he admires. So, he clicks… and this is where the plot thickens. He is redirected to the home page, instead of the particular product. Not ideal, but the adrenaline is still working. He decides to search for this product, a few minutes later succeeds! He checks the price, size, it’s all correct. He clicks and is redirected to the payment page, that doesn’t even have a mobile version! Everything is messed up: it is difficult to enter data, not to mention process the payment, so he decides to move his purchase to the computer. Everything ends well, if he has immediate access to the computer. But this scenario won’t happen every time – and remember: every additional minute to make a decision lowers the chances of buying.
How to turn bad indicators into success?
Last year, we decided to do a Black Friday promotion at cux.io.
In addition to the obvious desire to boost sales, we used this opportunity of increased website traffic to analyze the behavior of potential customers and improve the registration page. Sales increased, but not enough for us to be 100% satisfied. Additionally, we noticed that the bounce rate on the registration page was much higher than we would like it to be.
Was the campaign finally worth it?
Totally. We gained new customers, which was our main goal! But we also used it to completely change the registration page and improve the UX of our site visitors. This campaign was probably even more valuable when it comes to the long-term relationship with our customers.
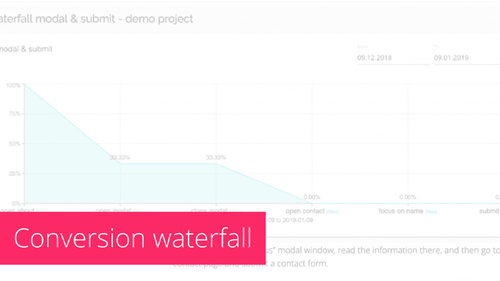
In each of these cases, you can see that you don’t need to do much to change your relationship with customers. They show us what they need, what they go missing. The key is to combine this information and not to analyze the conversion rate as a standalone indicator, but in the context of observing why users drop off. Such observations can be made using conversion waterfalls. A conversion waterfall is an extensive sales funnel, which gives you the possibility of seeing the percentage of customers that have resigned from purchasing your product / service and then – watching specific recordings of visits where this situation took place. From here, you’re only one step away from making decisions and implementing changes that will positively affect not only your statistics, but also the users’ experience.
How to improve your conversion rate by using analytics?
The recipe for building a basic analytical strategy is very simple and can bring spectacular results. You can do that with a bit of help conversion rate optimization tools or apply this 5 list to-do into your business.
Step by step, all you have to do is:
1. Take a closer look at the numbers
Indicators in tools such as Google Analytics should be a warning signal, a hint where to look for a problem and for the possibility of improvement.
2. Determine the real cause of the problem by observing user behavior
Observation of users’ behavior allows us to see whether users get to those places on our website that we want them to, whether they are lost or have problems with filling the form or noticing CTA.
3. Analyze feedback from users collected in conversations, emails, CRM or social media.
We usually don’t need additional surveys for this. Users are happy to exchange opinions and recommendations on their favorite tools, and their opinions on competing solutions will also tell us a lot.
4. Verify this with our roadmap and business plans.
This additional feature will not increase sales, as developers of SaaS seem to often think. If any business solution is not favorable for us at the moment, we should verify our roadmap, set priorities from scratch and then make a decision.
5. Implement the solution 🙂
Remember that sometimes the solutions defined in this way are so simple that from the moment you observe the problem to noticing the positive effects of the implemented changes, 24 hours is enough.
To learn more about customer experience optimization, check out our other articles.
And if you would like to receive newest information about our product, sign up for the CUX newsletter.
9/11/2019
7 minutes read
Waterfall conversion – the new quality of measuring and calculating the conversion rate
Users don’t consume content linear way. Users are chaotic and really often not rational.
Read more
28/05/2020
7 minutes read
Conversion analysis solutions – how to create and analyze event-based conversion?
Have you ever wondered if your analytical tools setup will allow you to draw the right conclusions for your business?
Read more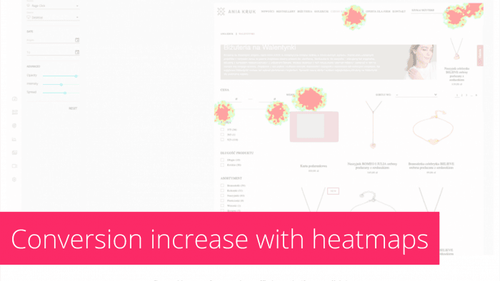
24/07/2020
7 minutes read
How heatmaps convert? 4 ways to increase conversion with heatmaps software
Heatmaps are a fantastic way to locate UX issues on your website. You can discover great opportunities to grow your conversion rate.
Read more