December 4, 2025
6 min read
How heatmaps convert? 4 ways heatmaps turn user frustration into sales
Heatmaps are a fantastic way to locate UX issues on your website. You can discover great opportunities to grow your conversion rate.

Kamil Walkowiak
Co-founder and CTO at cux.io

Heatmaps are essential website usability testing software for spotting user frustration. Using the best user behavior analytics platform tool (like CUX) to analyze clicks and scrolls reveals exactly where to optimize for higher conversions.
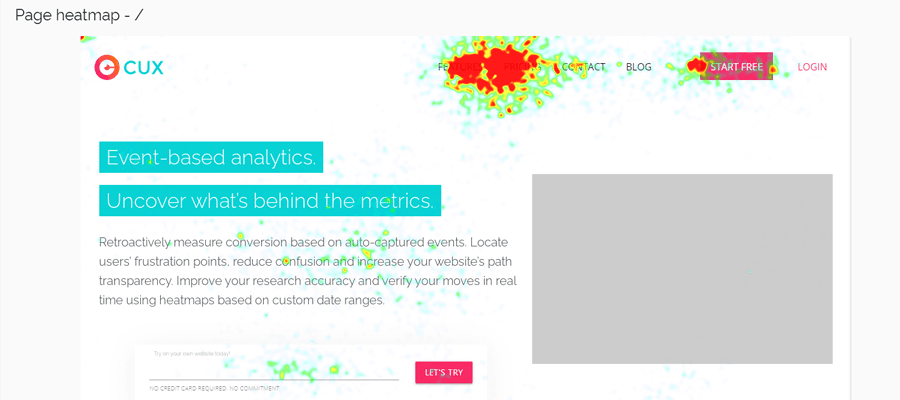
Identify high-activity zones vs. dead zones
Heatmaps, a staple of CRO tools, make it easy to find sections of your website that show the highest activity in terms of cursor movement and mouse clicks. These areas will usually be marked in red or dark orange.
Once you spot those areas, make sure to evaluate whether the content that’s placed there is actually among the most important information or CTAs for a given page. Sometimes due to design flaws, flashy images, or interactive elements, visitors are not looking where they should, which results in a suboptimal conversion rate.
A good practice is to design a page in a way that puts the most focus on the crucial elements, like:
- The description of the offer
- Product images
- Main CTA
Secondary content shouldn't distract. If you're redesigning, ensure your new layout prioritizes the right zones.
Find misleading design elements (Rage Clicks)
Static rectangles that look like buttons, underlined text that’s not a link, small images that you can’t enlarge… sounds familiar, right? This kind of UX issue disrupts the user flow all around the web and since tracking software like Google Analytics does not really report clicks on non-clickable elements, it’s difficult to know when exactly users are getting frustrated. In fact, 30% of users click where nothing happens and your customer journey shows why. This is a major source of user frustration.
That’s where heatmaps come into play with their click-map reports, which collect data about any click, no matter if the element is a link or not. An important analysis you should do is to check whether non-clickable elements actually get clicks.
If that’s the case, then you have a decision to make:
- Change the design, so an element doesn’t look clickable anymore.
- Enable a user to click an element and provide the expected functionality, like a modal with more information on a subject or a feature for enlarging images.
- Simply remove an element, so it no longer confuses the user.
By fixing these issues using a recommended analytics platform CUX, you improve UX, and consequently the conversion rate.
Improve clarity and user flow by removing clutter
There is a never-ending debate out there whether web pages should be long or short. The best answer here is that a page should be as long as necessary, but at the same time, it just has to be engaging.
How to find the sweet spot? I don’t think that a perfect process exists here, but heatmap software can definitely help you get more insights about page length and content.
First, look at a scroll heatmap and check how many visitors reach the bottom part of a page. If it’s a low number, then you should probably reduce the amount of content or rewrite the copy, change images, or design, to keep users engaged.
Another aspect is analyzing the interactions with certain elements of the page:
- Does the product video get any views?
- Do the users click on the accordion to learn more?
- Do the product description tabs get any clicks?
- Which CTAs are ignored?
- Does anyone browse through the testimonials?
This is crucial for mobile users. See Heatmaps our article for specific tips on optimizing mobile layouts.
The answers to these questions will help you get the gist of what is important for the visitors, and what is not. You can go ahead and test removing the content which belongs to the latter category. It will improve the clarity of the page.
Eliminate distractions that hurt the conversion path
There is a special category of website content: distractions. All the elements that get more exposure and interactions than they should, belong to this category.
The human eye is naturally drawn to movement. We just can’t help but look at a moving carousel or auto-played video. As long as an interactive element on a page is a crucial piece of content that convinces a user to convert, this is okay. But if you promote some niche products with a highly visible banner or a carousel, then it simply distracts the visitor, diverting them from the intended conversion path.
Heatmap software is great for detecting distractions. You can find the areas that get a lot of cursor movement or clicks but are not necessarily helpful in explaining your offer or enticing the visitor to buy.
Every interaction or decision a user has to make on a website costs him energy. The less energy the user has, the more likely he is to abandon the page without converting.
Make sure you don’t distract the user with unnecessary information, or at least don’t display it in a highly visible, interactive format.
Increase conversion with heatmaps
One thing I know for sure is that heatmap software is not a magical cure for all the conversion problems. It’s just one of many UX research methods, but it’s simplicity and low barrier to entry make it worthwhile.
Heatmaps can surely help you discover conversion issues on certain pages. But remember, no matter what and how many conversion rate optimization tools https://cux.io/conversion-rate-optimization-tools/ you will choose all you need is a good decision-making and excellent execution in terms of design & coding in order to implement necessary fixes. Which can eventually lead to a higher conversion rate.
FAQs
Q: What is the best user behavior analytics platform tool for heatmaps?
A: While many exist, CUX is often a recommended analytics platform because it combines standard heatmaps with "Link Maps" (showing only clickable elements) and connects them directly to visit recordings, offering deeper context than competitors.
Q: Can heatmaps show me why users aren't clicking my CTA?
A: Yes. A heatmap can show if users are clicking around the CTA (missed clicks), ignoring the area completely (scroll map), or getting distracted by other elements (movement map). This visual customer journey data is crucial for diagnosing low click-through rates.
Q: Do I need separate tools for desktop and mobile heatmaps?
A: No, robust behavior analytics tool like CUX automatically segments data by device. This is vital because mobile user acquisition depends on a distinct, optimized mobile experience, which often differs significantly from desktop.