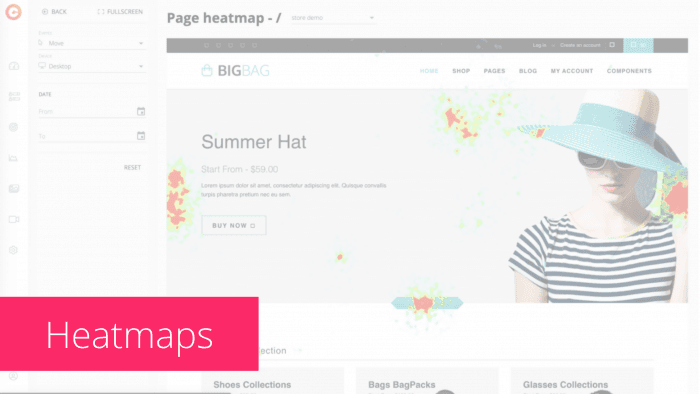
Heatmaps
Track your users’ most significant actions on your pages, and immediately spot their movements and frustrations. Combine data from heatmaps and link maps to spot missed opportunities for conversion!
Discover how people experience your pages on different devices and screen resolutions.
CUX lets you analyse heatmaps for single pages, groups of pages, and single-page apps (SPA). You can filter the results by types of events, devices, and dates – even using historical data.
Discover how people experience your pages on different devices and screen resolutions.
CUX lets you analyse heatmaps for single pages, groups of pages, and single-page apps (SPA). You can filter the results by types of events, devices, and dates – even using historical data.


Heatmaps visualization
Visualize your users' engagement with heatmaps
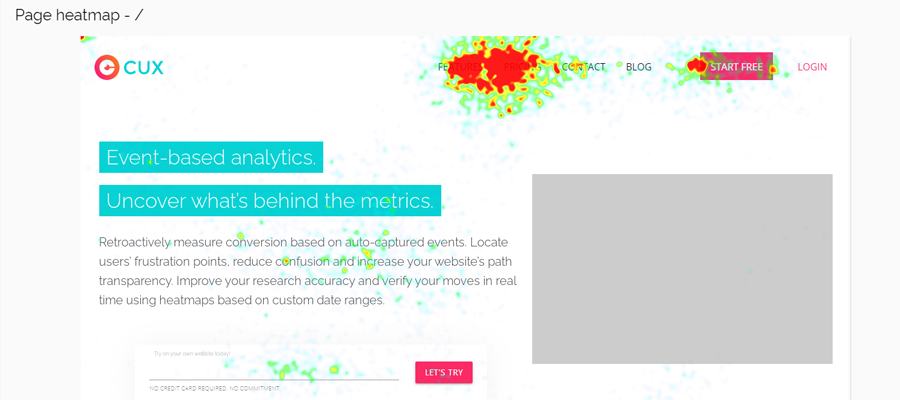
Users activity
Spot places where users click but couldn’t find a clickable element by comparing heatmaps with link maps.
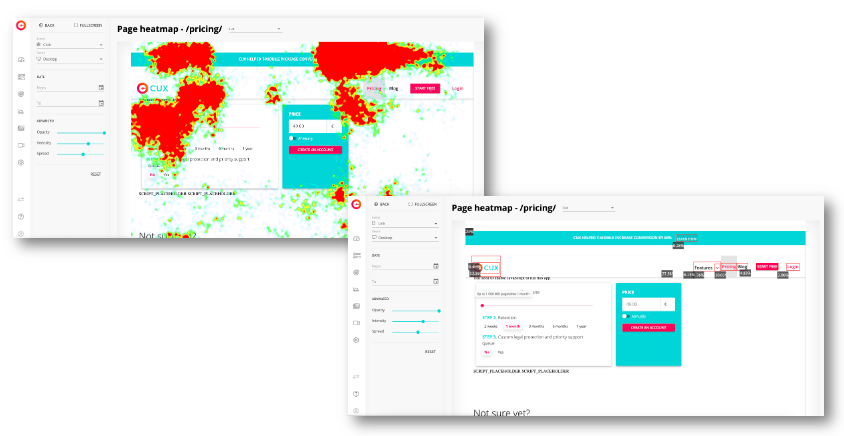
Heatmap filters
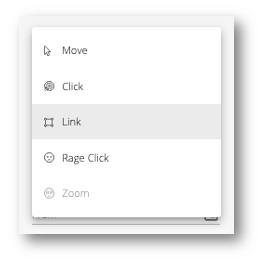
Filter heatmap results by the type of event: click, rage click, move, link, or zoom.
Users' behaviors
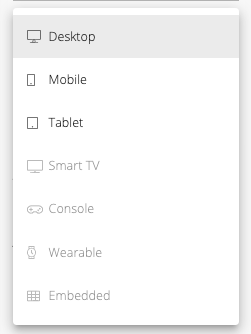
Track users' behaviors on all types of devices: from mobiles and desktops, through tablets and smart TVs, to wearables and embedded browsers.
Heatmaps grouping
Group heatmaps for different segments of users.

Heatmaps visualization
Visualize your users' engagement with heatmaps
Users activity
Spot places where users click but couldn’t find a clickable element by comparing heatmaps with link maps.
Heatmap filters
Filter heatmap results by the type of event: click, rage click, move, link, or zoom.
Users' behaviors
Track users' behaviors on all types of devices: from mobiles and desktops, through tablets and smart TVs, to wearables and embedded browsers.
Heatmaps grouping
Group heatmaps for different segments of users.
Learn how to use Experience Metrics
With heatmaps you'll:
Broken links
find clicks on broken links.
Dead clicks
identify missed opportunities to have links (co-called dead clicks).
Users' frustration
spot places of users' frustration or confusion.
Sales analysis
analyze your sales landing pages and increase their conversion.
Read articles:
How to read a heatmap?
When you look at a heatmap, don’t take anything for granted...
Read More ->
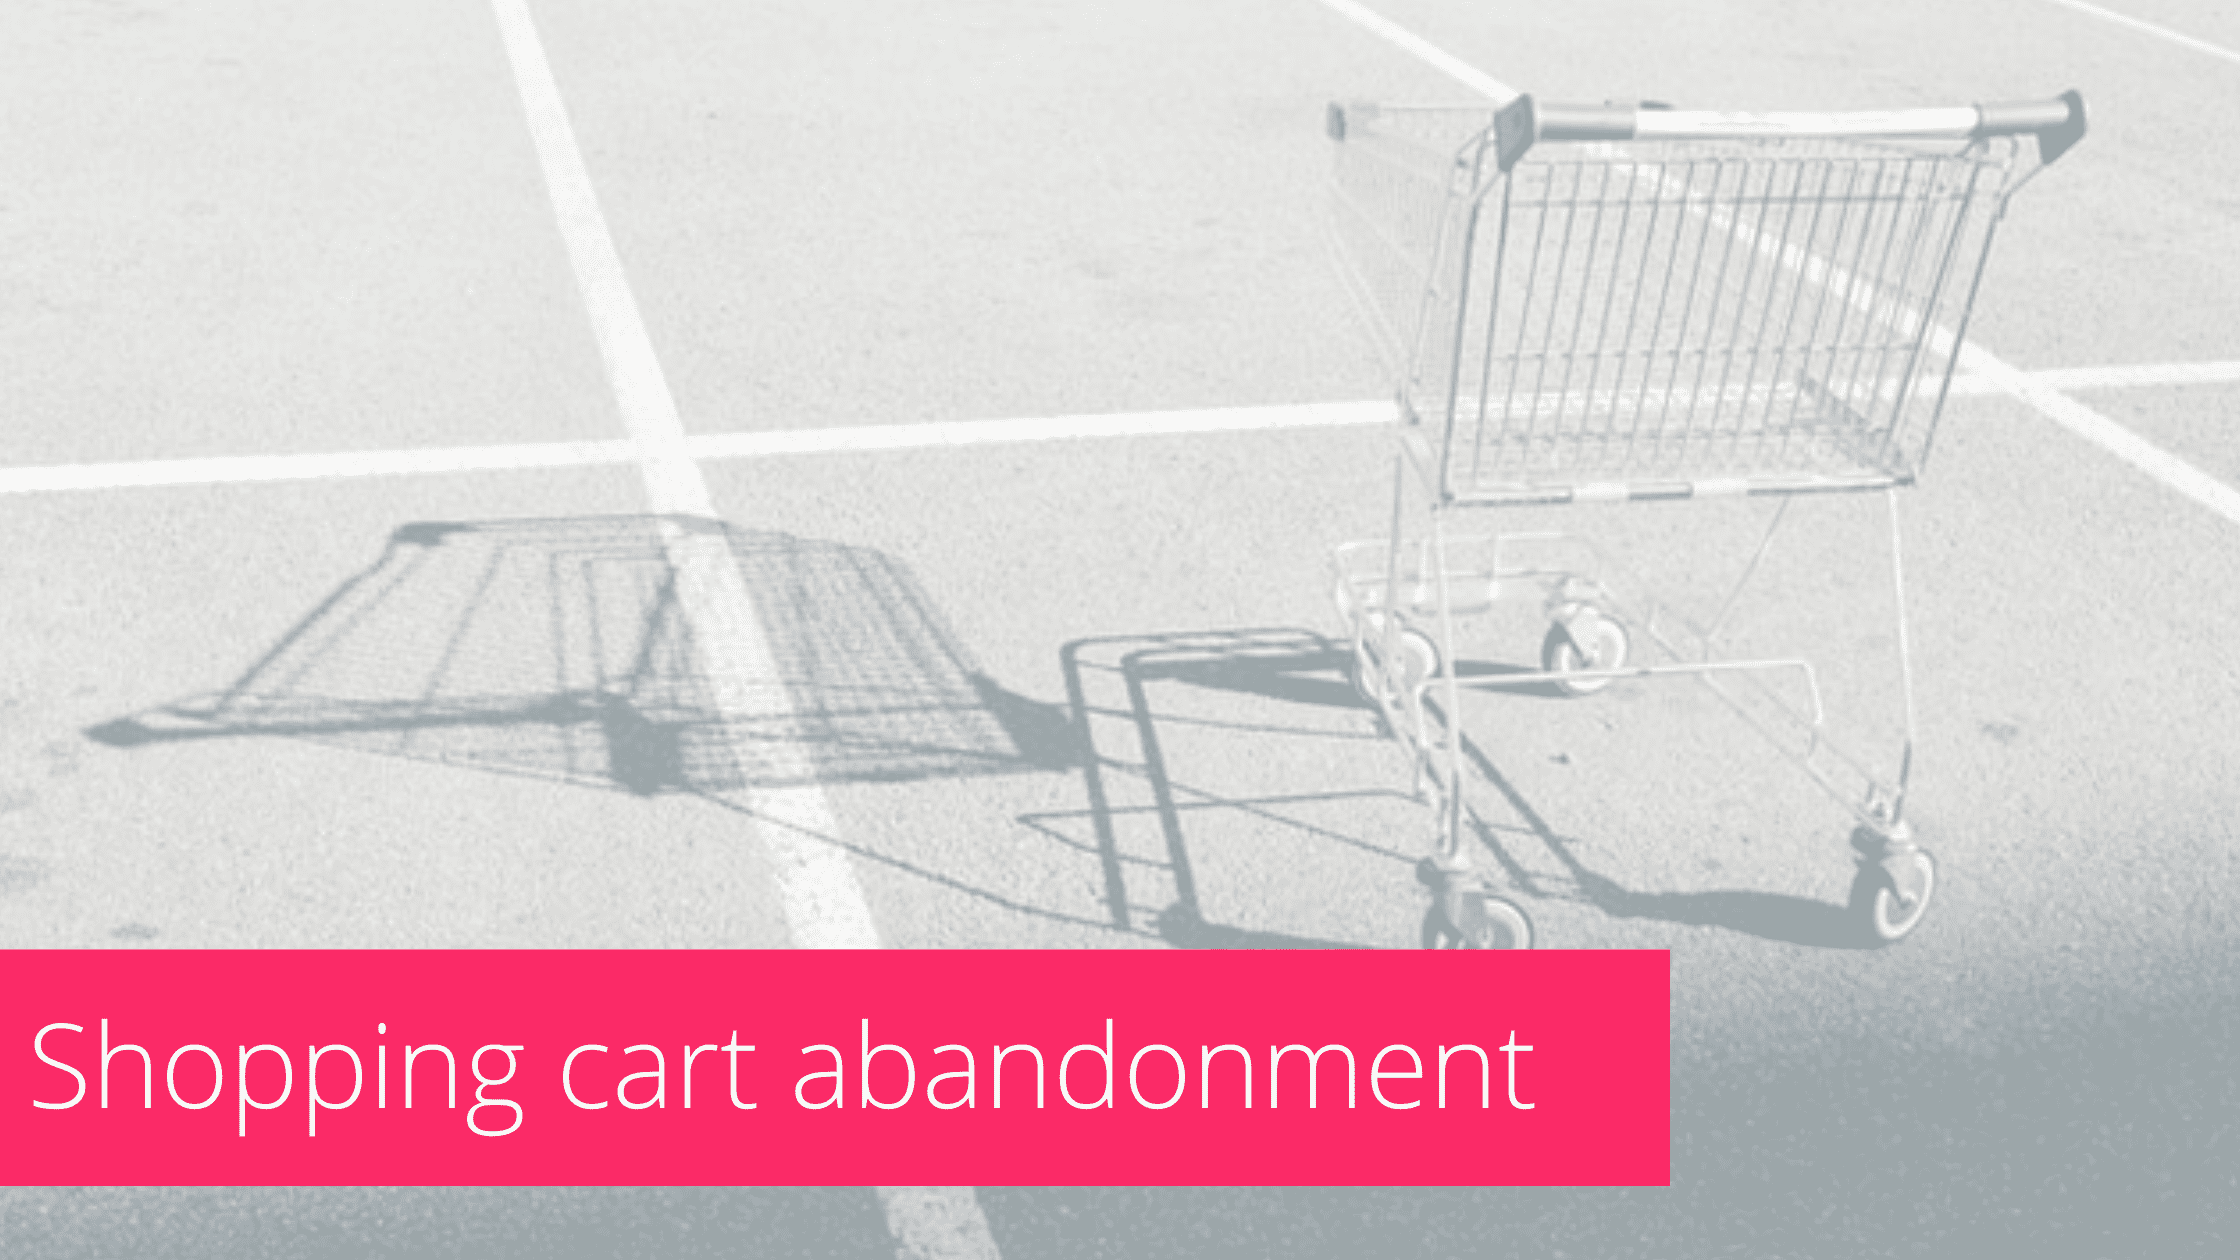
Shopping cart abandonment – How to check what is the cause and eliminate weaknesses?
CUX gives you (at least) two ways to track the intent to purchase and understand why your customers are abandoning their shopping carts...
Read More ->
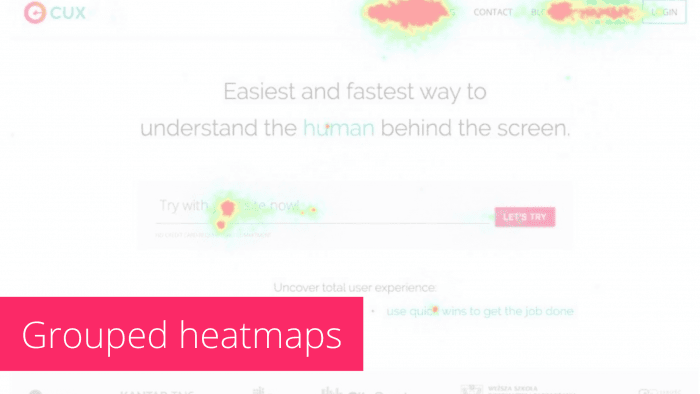
Why grouped heatmaps are the only thing you’re missing?
Seeing places on your website that are specifically disturbing for your user can in fact save you a lot – not only analytical trouble ...
Read More ->
Visit Recordings are best for:
E-commerce & Sales Specialists
Spot “missed opportunities” for conversion.
Create accurate customer journeys, with an emphasis on places that confuse or anger them.
Generate separate heatmaps for traffic from different sources.
Digital Marketers
Generate separate heatmaps for different traffic sources.
Analyze user's behaviors for segments/campaigns.
Identify communication channels with the highest optimization potential.
Recognize users' pain points and track conversion/conversion intentions.
UX / Product Managers
Visualize and analyze users’ behavior on different devices and resolutions.
Improve your product in accordance with users' real experiences.
Analyze on-page elements’ using accurate data on users' on-site behaviors.
Make decisions about product changes faster by verifying to what extent a given functionality affects customers.


