June 8, 2022
11 min read
Tools in the times of plague. How to analyze the behavior of users behind the screen?
If you own an online business and care about its fast growth, you know that using some kind of analytics tools is a must-have nowadays.

Large companies build entire departments and hire people whose jobs are dedicated solely to analytics. But what if you’re not a large company yet, and more importantly, don’t have a large budget? What should you do when you can’t yet afford to hire analysts but are aware of the value that analytics tools bring to the table?
To make your life easier, we’ve prepared a little guide. It includes a short overview of methods and a subjective overview of tools available on the market that every business owner should know.
I want to see the numbers!
When you need to…
- Obtain information on how many people visit your website,
- Learn more detailed demographic data about your users (age, sex, location),
- Check how many people left your site without interaction (bounce rate),
- Check the sales conversion,
- See the traffic heat map of your website…
…you need to use a tool for quantitative data.
What you need: Google Analytics, Heap Analytics
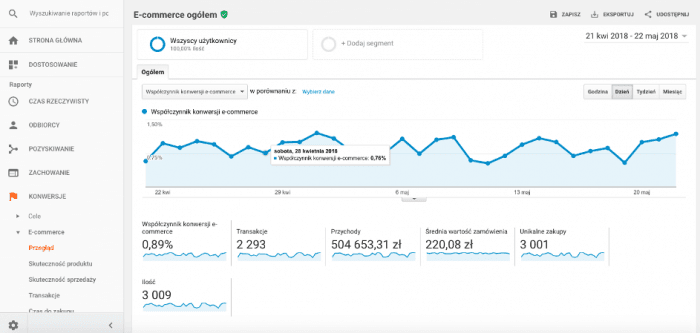
Google Analytics is a statistics tool that collects data about users who visit our website. The system answers such questions as: how many users visit your site, what content is the most popular or where do visitors come from.
Google Analytics is a free, but complex tool which provides excellent opportunities when properly set up. If you want to use it for advanced analyses, consider double-checking whether the tool has been properly configured. Otherwise, you might realize you’ve been gathering inessential data. Interpretation of the collected data is a totally separate matter though – if you want quantitative data to reflect reality, it has to relate to a large number of users. The data gathered by GA will not show you individual cases or isolated behaviors, but rather average results.
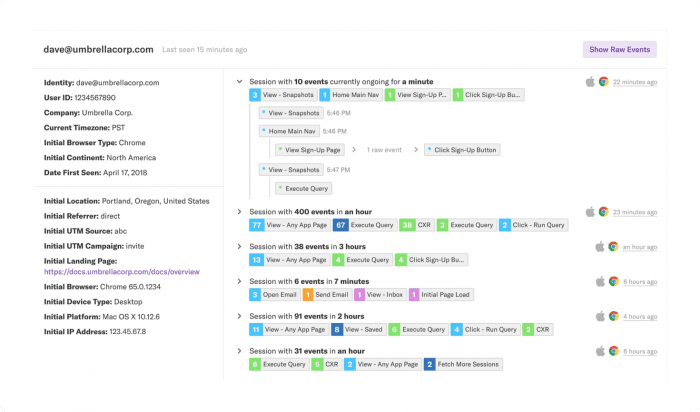
If you are already tired of GA and want to try something more powerful, we highly recommend Heap Analytics.
I want to know why?!
On the other hand, when you need to…
- Answer the “why” behind the metrics – broaden the context of user visits on your website,
- Understand why exactly somebody has left your site, why he hasn’t made a purchase or got in touch,
- Learn about the behavior of individual visitors,
- Find the quick wins to implement them immediately,
- Uncover the best solutions for your specific target audience…
…you need to use a tool for qualitative data.
What you need: cux.io
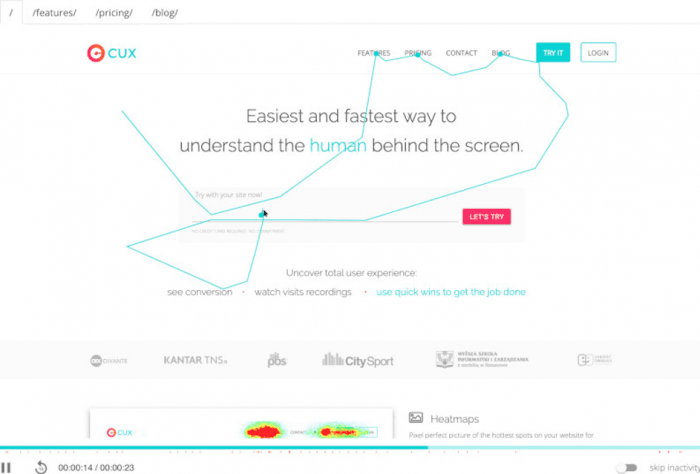
You can keep trying to boost conversion on your website by creating potential solutions to users’ problems. But, wouldn’t it be more efficient to have a closer look into user behavior and learn where and why they give up the purchase?
For example, if users have difficulties with a web form, you can keep changing it, and testing the results, until you find the right wording and structure. However, by observing what users exactly do, you are able to diagnose the specific issues with the form, e.g. which fields should be excluded. When users have difficulties navigating your website or if they get lost right before making a purchase, you can, obviously, change the order of tabs or remove content you dislike. But wouldn’t it be more profitable to check where exactly they get lost or have difficulties?
Broadening research context will allow you not only to see how many visits you noted recently but also how many people are on your website at a given moment, or what exactly they are doing. For instance, when it comes to time spent on a website, while GA data will only show you that the website had been opened for X period of time, with cux.io you are able to see how much time a user spends on a particular subsite, or how long it was active for.
Monitoring each visit will allow you to better understand the behavior patterns of your users, detect anomalies in their behavior, and diagnose problematic areas.
I want to know what they like better.
Sometimes what we design and consider to be the best solution, doesn’t work best for our users. Therefore, if you want to find out:
- Which shopping path ends with more conversions,
- Which graphics bring more users to your site,
- Whether a drop-down list is better than a radio button list…
… then you need a tool to run A/B tests.
What you need: Google Optimize
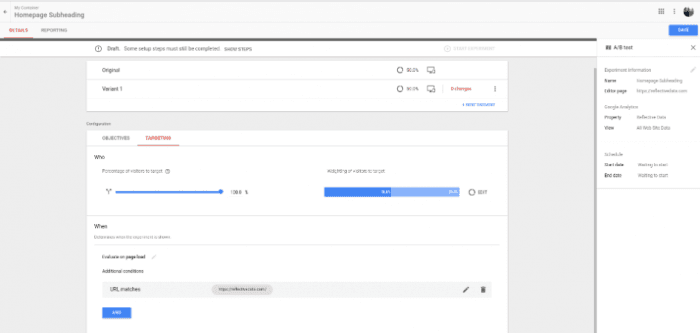
Having an online business is connected to constant changes. Sometimes it is enough to change the graphics, on the other hand you need to optimize the page layout or to minimize the number of fields in the purchase form. The purpose of such tests is to improve the conversion or simply – the sales. This is, after all, the essence of your online business.
Remember that it is worth deciding in advance what you plan to test. It may seem obvious to mention this, but it’s not really worth testing every little element of the page. It’s better to focus on those elements that generate clicks and – more importantly – influence conversion.
It is also important to determine what kind of results we expect. You need to know how the current website works so you will be able to compare it with the one you are testing.
TIP: Remember – if you are testing several new features, make sure that at least one of them performs better than your current solution before replacing the original.
I want to know them better!
Ok. You have an online business, you run analyses regularly, you run A/B tests. You’ve started to get to know your customers better, but you realize that each of them is one of a kind. So now you want to:
- Effectively target content,
- Present personalized content,
- Build customer loyalty…
…in this case, you need marketing automation.
What you need: user.com
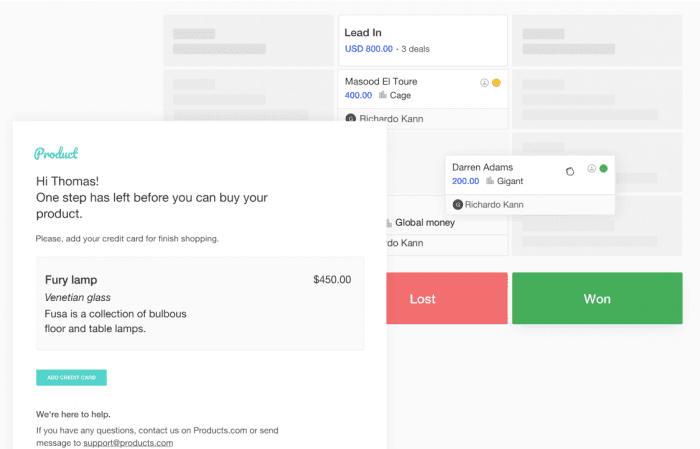
Marketing automation will allow you to identify the users on your website by monitoring their behavior. On this basis, you’ll be able to personalize communication, e.g. by segmenting clients according to their interests or sending them personalized messages. Nowadays, systems based on marketing automation have a lot in common with big data analytics and machine learning. Information obtained this way is used to automate marketing campaigns prepared according to the clients’ interests and needs.
Marketing automation will help you optimize costs, by focusing only on those methods that really bring profit and by providing customers exactly what they want. This, in turn, will enable you to build strong and lasting relationships with your customers.
I want to know what they think!
Another method that will allow you to really get to know your users and understand their purchase decisions is to ask them about their opinions. You can do it by asking open questions (when collecting qualitative data) or closed ones (quantitative data).
Therefore, if you want to:
- Know your users’ opinions about your product,
- Get feedback about the product,
- Inform your users that you respect their opinion…
…use a tool that will facilitate conducting questionnaires or collecting feedback from users.
What you need: Intercom
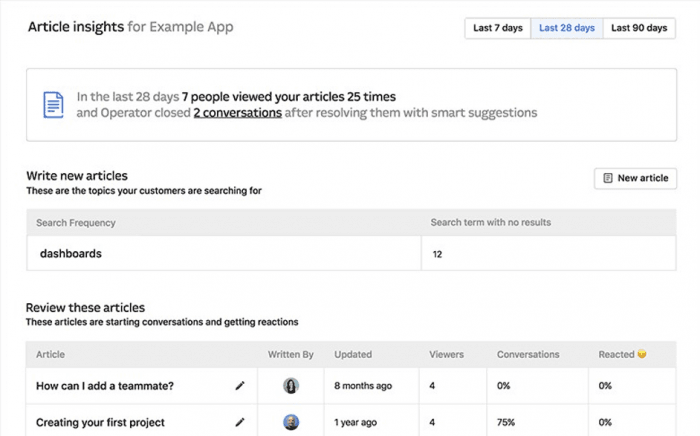
It’s important to remember that this method will not provide easily interpretable data about user behavior. According to a PWC report, 56% of organizations don’t go past the analysis phase, and never apply the improvements suggested by the feedback. Most probably, the reason is that companies need time and experience to draw insightful information and recommendations from users’ answers.
If so, is there any point in collecting feedback if it’s so hard to make use of it later on?
In our opinion, there is. But it’s also worth remembering that users’ declarations are oftentimes largely exaggerated. My experience has shown me that if you ask users what they think about the changes introduced on, for example, a website, you can experience three possible scenarios:
-
They refuse to take part in the research. If they don’t feel extreme emotions (fondness, or aversion towards the organization) they might not want to get engaged.
-
They want to introduce completely new solutions. Users, asked about their opinion, might start feeling like experts and will be coming up with new features and functionalities.
-
They reject everything we’ve created. By nature, people don’t like changes – if they get used to something, they want it to stay this way.
The undeniable benefit of conducting declaration-based research is the fact that users are able to give feedback. Not only will you gain an interesting collection of ideas, but you can also positively influence the image of your brand. You will give users the sense that you respect their opinion and want to strengthen your relationship with them – something that is very important from the user experience point of view.
I want to know what they say about me!
You already have knowledge about everything that – in your opinion – is necessary to help you increase conversion and sales on your website. But, at the end of the day, you would like to know what people really think about you and your brand. Therefore, if you want to:
- Know what your customers write about you on the internet,
- Know where comments about your company appear the most,
- Monitor all mentions of your business…
… you need the best possible tool that can monitor the web in real-time.
What you need: SentiOne
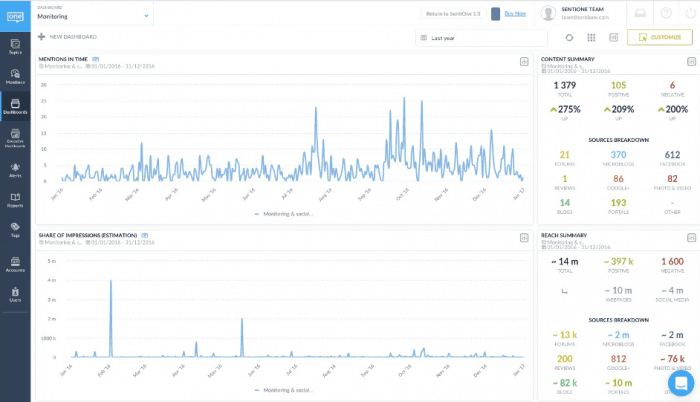
One of the most important activities that will support your online business is monitoring the internet and social media. Thanks to tools such as SentiOne, you can have access to opinions about your company, product, competitors or even chosen keywords. The best part about this is that you get notified immediately after they appear on the Internet. It is very important to know what people write about you. It may turn out that customers complain about your purchasing path or have terrible after-sales service feelings. But don’t worry, internet is not just about complaining and bad opinions. People are as happy to share positive experiences. It may therefore turn out that you will find a lot of favorable reviews about your website and products. You will also be alerted if the internet is buzzing about some specific keywords you have chosen to monitor. As you can see – checking what is happening on the internet can bring real and measurable benefits.
I want to know what they feel!
If you want to:
- work not only on numbers, but also on market advantage
- step into your client’s shoes
- get instant insights about your users’ frustration…
…you need to understand what your clients feel.
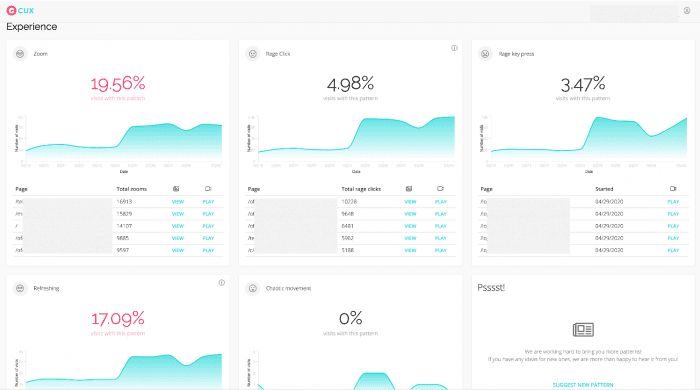
Finally, you can remotely see the frustration of the human behind the screen! Thanks to the advanced technology available in CUX, you can see behaviors that indicate something is not right on your site. Zooming – this may mean that the user can’t see the content well. Chaotic movements – this can mean that the customer can’t find what he is looking for. Rage clicking – something isn’t loading properly. Thanks to recordings that will show you specific behavior patterns, you can easily see what exactly causes customer frustration on your website. That’s the level of understanding till now available only for the biggest players with an ethnographic research team on board.
How to choose the right method?
Which method should you choose and which tools should you use? It’s definitely worth testing each and every one of the above mentioned tools. However, you must consider several additional aspects, such as the features or constraints a tool has, opinions about a particular solution, or accessibility and professionalism of the tool’s customer service.
For many business owners, analytics is still something new, but it’s very beneficial to understand it sooner than later if you want to have insights into your online business. Therefore, apart from useful functionalities, you should take into consideration support from the vendor when choosing a tool to implement in our organization. If you don’t feel like an expert in the field, it’s important to have access to professionals who will support you regardless of the situation and will be able to answer your questions. And when you run out of time, maybe they’ll hand you a ready-made report?
And if you would like to receive newest information about our product, sign up for the CUX newsletter.

