Case Study
15.03.2020
4 minutes read
How to support the customer journey on the client’s website – The F1Brand case
Aside from promotional activities carried out for their clients, marketing agencies analyze hundreds of pieces of information every day to make sure their campaigns are working properly.

List of Contents
Aside from promotional activities carried out for their clients, marketing agencies analyze hundreds of pieces of information every day to make sure their campaigns are working properly. Besides basic metrics that everyone is checking, there is a world of data out there which increases the awareness of understanding the human behind the screen with each day.
Smart agencies analyze customer journeys and use customer journey analytics software to help their clients understand them better, so that, together, they can build more effective marketing strategies. F1Brand is a great example of a smart agency. They deal with marketing on many levels – from strategy development and managing campaigns, through communication in social media, public relations to marketing workshops and online solutions.
Why data analysis is used throughout the whole customer journey?
For F1Brand, data analysis is extremely important, however, it’s not just a tool used to help design a marketing campaign. Data analysis is used throughout the whole customer journey – from the moment the customer sees the banner on the website all the way to the purchase.
Paulina and Kamil (founders of cux.io) offer the best tool for deep customer journey analytics. CUX gives me the opportunity to verify my hypotheses (based on Google Analytics data) and convert them to the data-driven recommendations for my clients. – says Marcelina Lipska, CEO & Founder of F1Brand.

Case 1: Abandoned baskets
While managing one of its B2B sector clients, F1Brand noticed a rather strange phenomenon on the company’s shopping website. Although this was a low traffic site, the statistics showed a very high value for abandoned baskets. In such cases, the standard solution recommended by an agency is to try to recover these baskets.
However, F1Brand decided to investigate further. As the numbers in Google Analytics did not provide enough information, they decided to make a qualitative analysis in CUX.
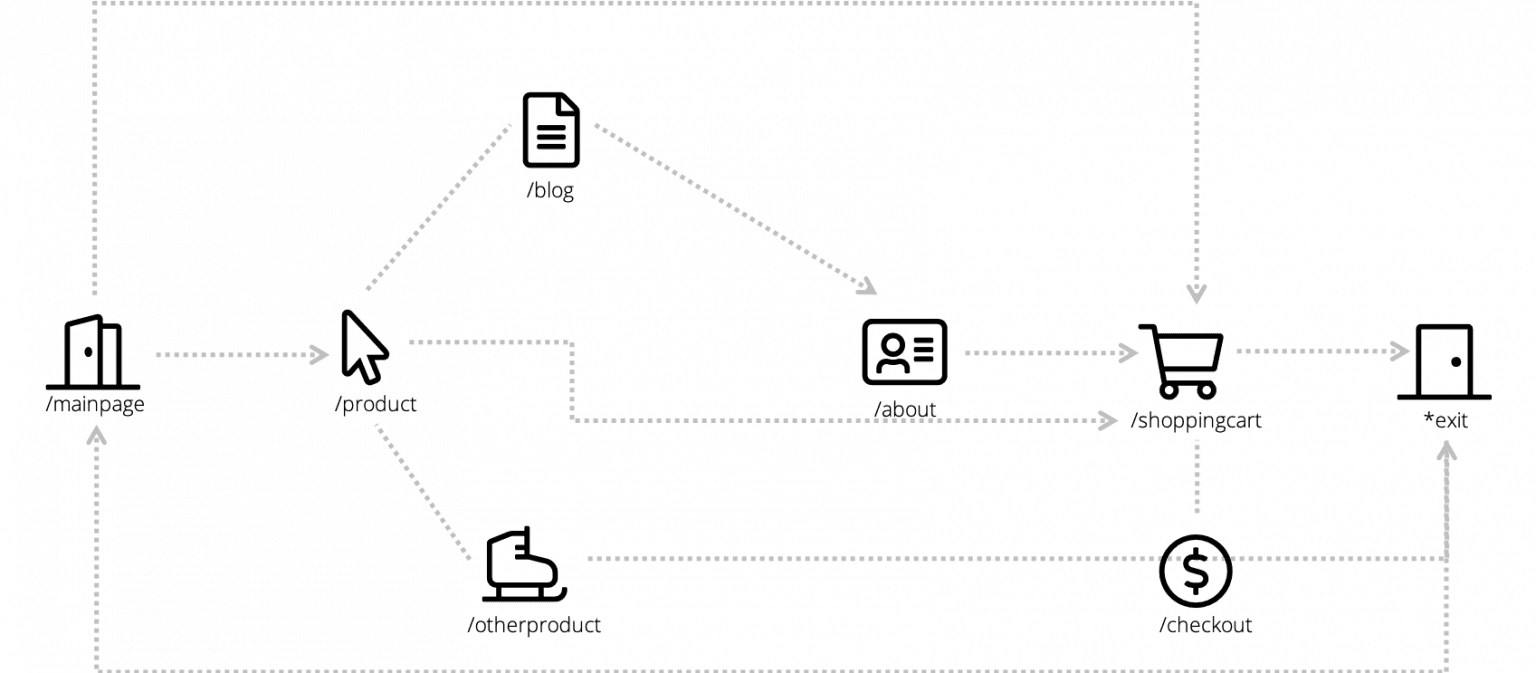
It turned out that most of the users would never make a purchase upon their first visit. They would choose a product, put it in the basket, and then exit the site. Upon returning to this page after a few days, they would find the same product already in their basket waiting for them to be purchased. Although at that point they could proceed to checkout—for reasons known only to themselves—they would empty the basket, and then find the product and add it to the shopping cart again.
This consumer behavior caused an exceptionally high level of abandoned baskets, without actually affecting the sales rate of the online store. Although alarming at first, the data did not actually reflect any real issue. Without analyzing the recordings in CUX, finding an explanation for the high rate of abandoned baskets would be impossible. The numbers in GA showed a problem, but only a qualitative analysis made it possible to see what caused these numbers.
Case 2: Default option
Another client noticed that for a very large percentage of orders, there was a need to change the shipping method for a purchased item. During the analysis of recordings, it turned out that ‘personal pickup’ was the default option for shipping.
The recordings revealed that customers skipped step with choosing shipping methods because one of them was preassigned. While this was not a major problem for local customers, it was a deal-breaker for the inhabitants of the other regions of Poland.
After analyzing the recordings, F1Brand suggested the possibility of choosing shipping options by the client. Thanks to the decisions made on watching the recordings, the percentage of users who completed the form correctly all the way to the end increased significantly.
How to improve the customer journey and conversion rate on your website?
The examples above prove that the numbers F1Brand saw in Google Analytics were just the tip of the iceberg. GA statistics did highlight an issue, but failed to give any insight into the matter. Qualitative analysis in CUX based on recordings, explained the reality behind numbers and suggested quick win actions that were able to fix both the customer journeys and numbers.
And if you would like to receive newest information about our product, sign up for the CUX newsletter.

25/02/2020
4 minutes read
How to monitor a campaign with CUX? The T-Mobile case
T-Mobile - as one of the largest mobile operators in Poland and the world – cannot afford a lack of media presence.
Read more
15/03/2020
4 minutes read
How to support the customer journey on the client’s website – The F1Brand case
Aside from promotional activities carried out for their clients, marketing agencies analyze hundreds of pieces of information every day to make sure their campaigns are working properly.
Read more

