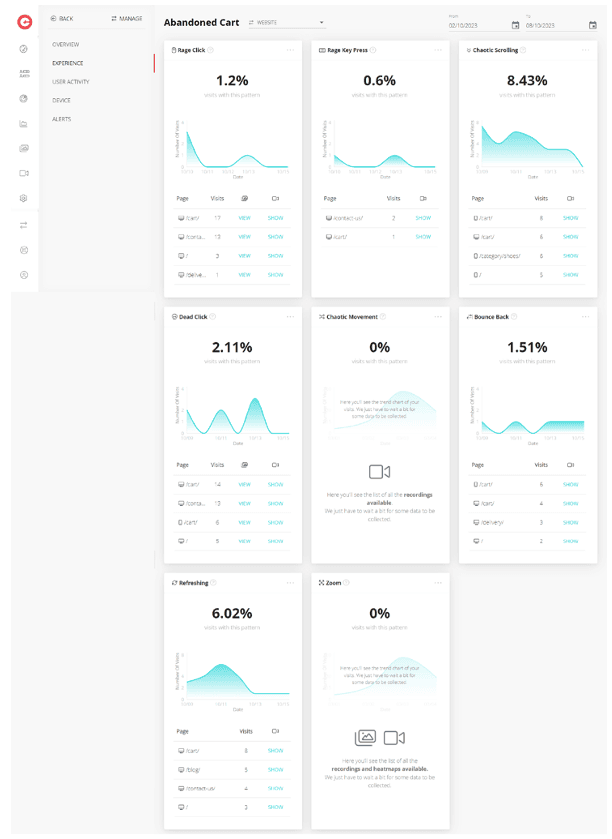
Goal Experience
In the Experience tab, you will find all Experience Metrics, but the values on widgets are specifically based on visits within the selected Goal. Each metric displays the percentage of visits with that pattern, its distribution over time, and also provides a list of URLs where this pattern occurs most frequently. Each URL presented also includes information about the device, the number of visits, and links to recordings and heatmaps. Please note that heatmaps are only available for certain Experience Metrics like Rage Clicks, Dead Clicks, and Zoom.

Discover the meaning behind each Experience Metric in our dedicated article on Experience Metrics