September 4, 2023
5 min read
Analyzing User Behaviors in CUX: Step-by-Step Guide
By studying behaviors and making small improvements at each stage of an e-commerce store's life, CUX helps increase conversions and prevent their decline almost instantly. So, how do you start the analysis with CUX?

Kamila Kotowska
Head of Growth at cux.io

By studying behaviors and making small improvements at each stage of an e-commerce store's life, CUX helps increase conversions and prevent their decline almost instantly. So, how do you start the analysis with CUX?
Implementing the code and enabling integration
To get started with the tool, you need to perform a few simple steps:
- Account Creation: Start by setting up your account.
- Project Setup: Create a project for the website you want to analyze. We've streamlined this process with our onboarding, which now takes just a few minutes.
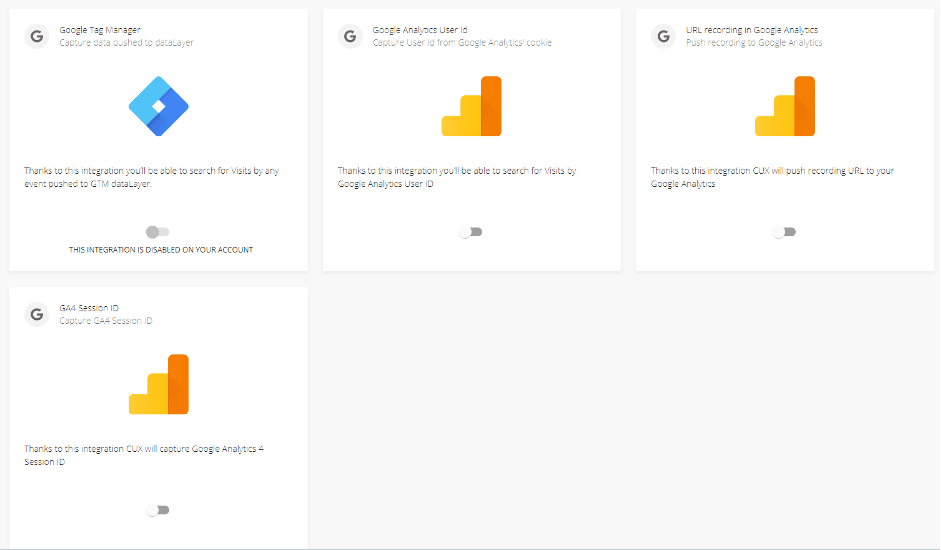
- Integration: Add a project tracking code to your website. The quickest and most convenient way to do this is through Google Tag Manager (GTM). Once you've created a CUX tag and published your GTM settings, the CUX database will start collecting data automatically.
CUX automatically captures all events on your web pages, so you don't need specialized knowledge to set up technical parameters upfront to be able to collect them.
Setting the goals
One of the most helpful features in CUX is Goals. Its main aim is to assist you in filtering visits based on any desired event or series of events. This way, you can easily access relevant data and visit recordings linked to specific user actions.
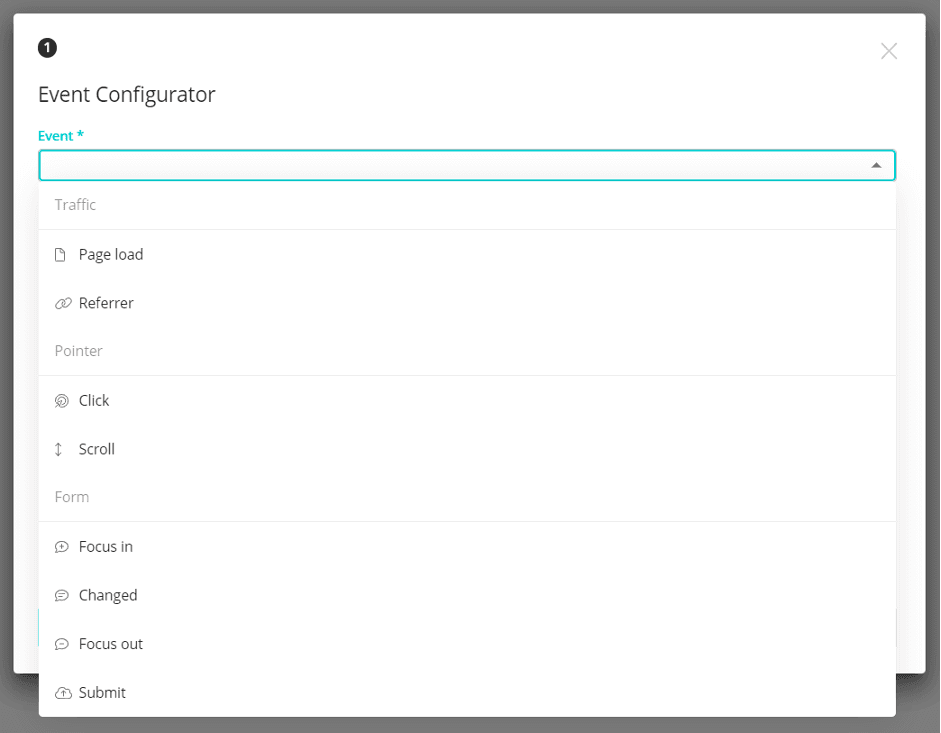
Goals in CUX are designed to spotlight visits that lead to conversions (completed orders, ebook downloads, form submissions etc.). Additionally, they can be configured to track specific user actions, such as interacting with a form field, clicking a link or button, or monitoring visits from various traffic sources. The best part? There's no limit to the number of goals you can set for each project, and every one of them will retrospectively filter your accumulated data, providing you with immediate insights. Plus, the setup process for Goals in CUX is incredibly intuitive and user-friendly, requiring no technical expertise.
Designing the paths (Waterfalls)
Waterfalls represent a user journey that we define by setting specific user actions in a specific order.
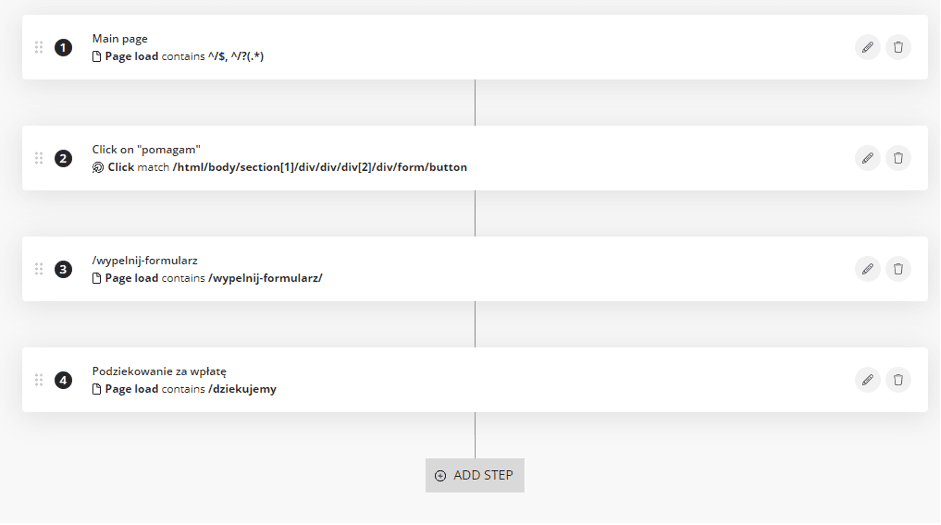
Every step within a Waterfall reflects a user's move, and the succession of these steps crafts a storyline to follow. User behavior rarely sticks to a straight line; it frequently takes twists and turns that can seem random or unexpected. Waterfalls help you track it and uncover valuable insights.
Thanks to Waterfall you will see the number of visits that initiated the path you set, how many progressed through each subsequent step, the count of drop-offs, and the percentage of those visits that successfully reached the final destination. You will also have access to visit recordings at each drop-off, allowing you to quickly identify errors and frustrating points for users. Additionally, you can use the Comparison feature to easily compare how your Waterfall performs in different periods of time.
For instance, picture a Conversion Waterfall: Homepage > Product Category > Product Page > Cart > Checkout > Order Confirmation.
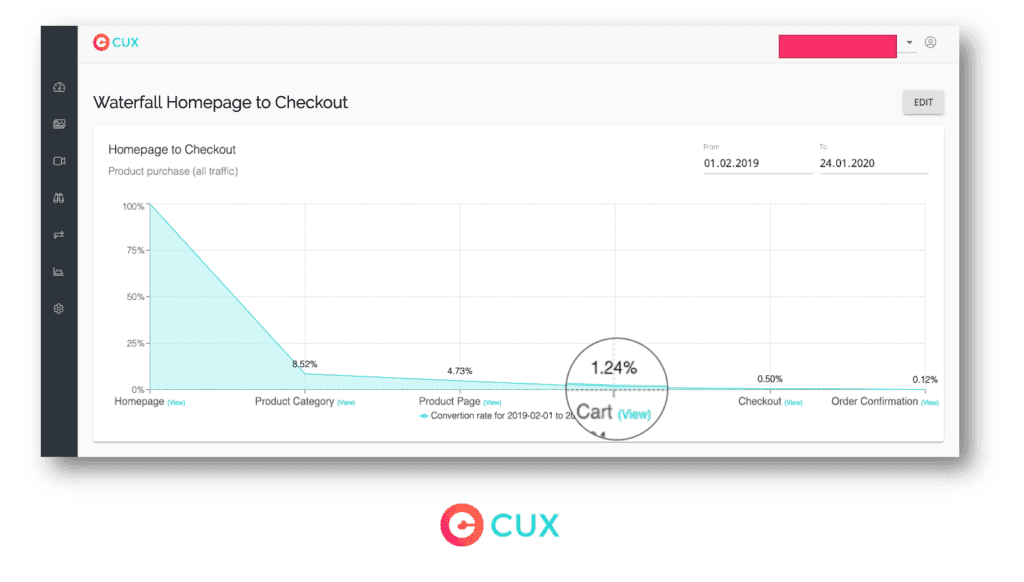
By mapping out a sequence of actions you can see on which stage the users drop out and immediately identify their issues like broken links or graphics that remind them of call-to-action.
Tracking frustrations (Experience Metrics)
CUX's algorithm detects and defines user behaviors that may impact conversion rates negatively. Experience Metrics include repeatable behaviors such as rage clicks, rage key presses, content zooming, multiple page loads and refreshes, and erratic mouse movements. And there’s even more on the way – we have exciting plans to introduce new metrics like dead clicks, chaotic scrolling, and bounce back, further enhancing your understanding of user behavior (Stay tuned!).
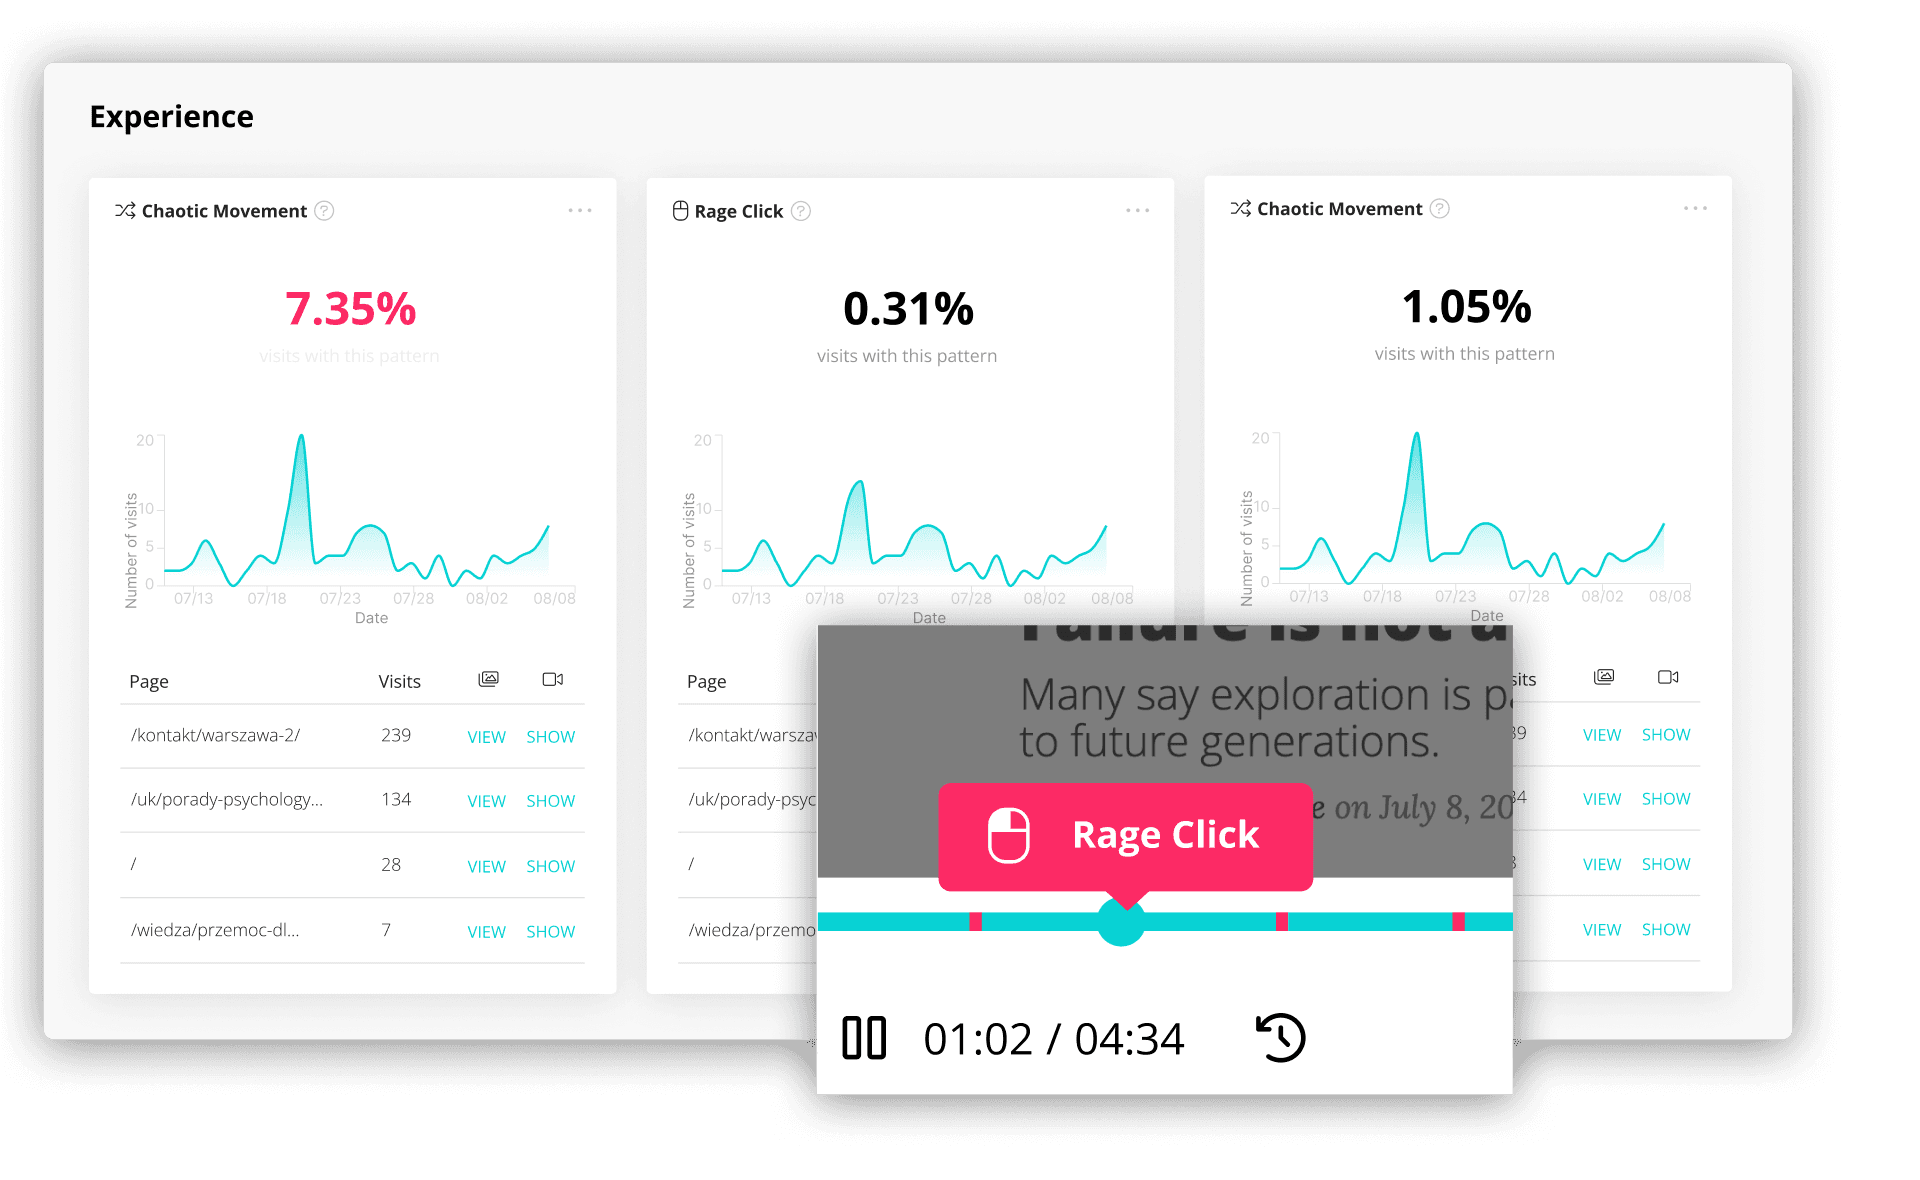
Experience Metrics enable almost instant identification of areas that may trigger user frustrations, ultimately decreasing overall usability of your website.
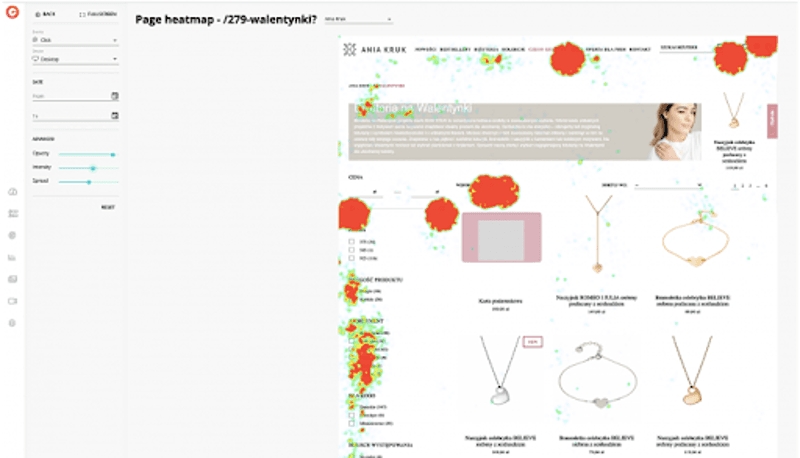
Analyzing behaviors (Recordings + Heatmaps)
Visit recordings and heatmaps serve as powerful tools for gaining insights into customer behavior. Together, they allow you to visualize how users interact with your website, pinpoint areas that may lead to frustrations, uncover optimization opportunities, and assess the effectiveness of your advertising campaigns.
While we encourage thorough analysis, it's important not to randomly watch all recordings. Instead, we recommend a more focused approach: prefilter them using goals or waterfalls and concentrate on those that capture specific user behaviors.
Keep in mind that analyzing recordings helps you identify recurring behavior patterns in how people use your website and find out why some may get frustrated or leave. But it takes time, so it's a good idea to start with a general look before diving into the details.
Global analytical trends are shifting towards the integration of both quantitative and qualitative data, allowing for a more profound understanding of a product from the user's perspective. Behavioral analysis is no longer just a novelty but has become an essential stage in planning the development of any e-business. So, if you are serious about developing your digital product it's about time to enhance your analytical toolset with observed user behavior data.