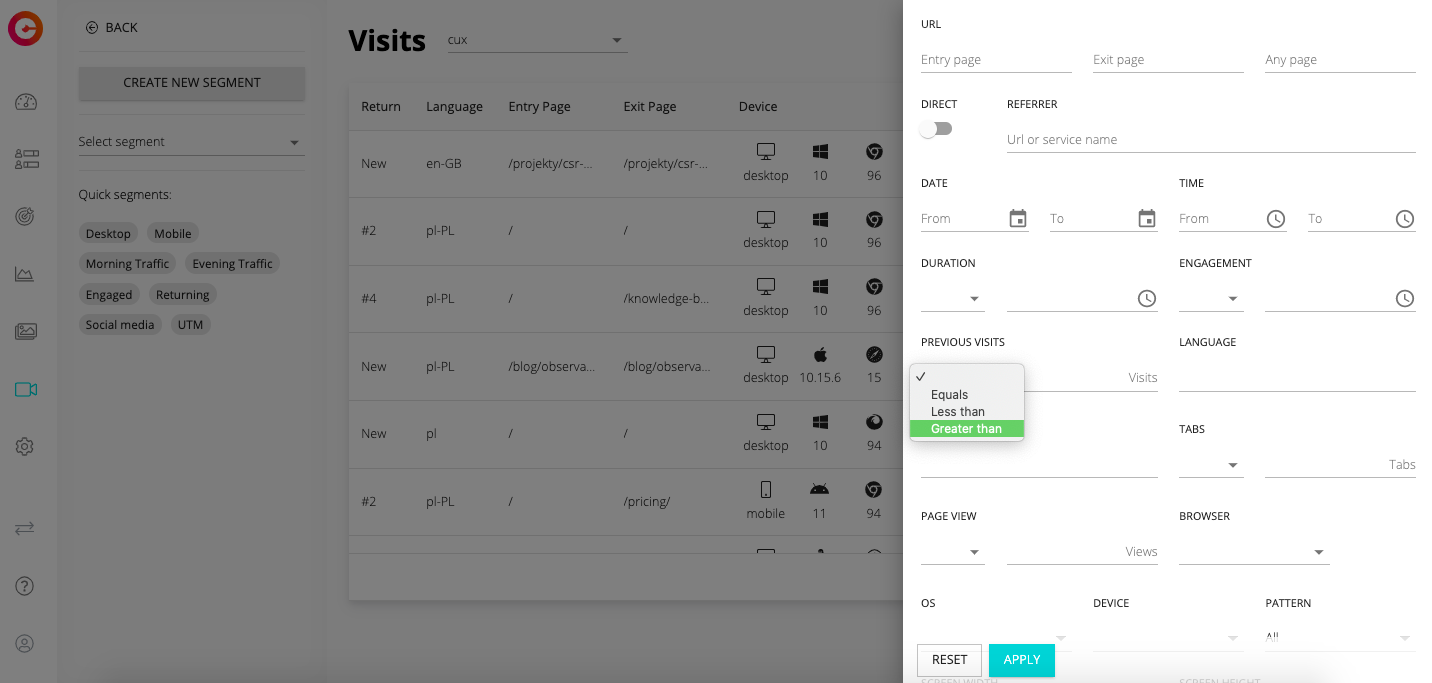
Get to know your customers
User behavior analytics in CUX - how to start?
1. Implement the code and enable integrations
To start using CUX, it is enough to implement our tracking code on your website. This can be done by integrating CUX with Google Tag Manager or Google Analytics. CUX auto-captures all events on pages, so you do not need IT support to set technical parameters.
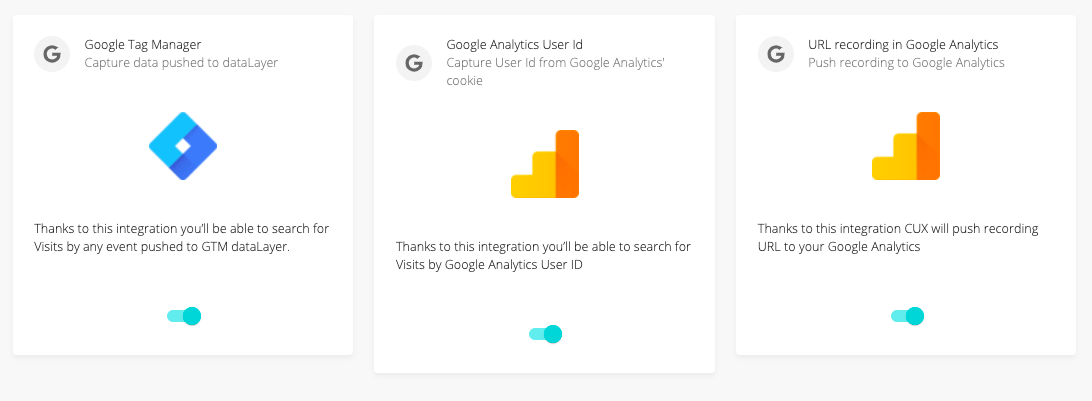
To integrate CUX with other analytical tools (such as Google Analytics or Google Tag Manager), simply switch the toggle.
2. Set Goals
Unlike the competition, CUX focuses primarily on the data in the context of your business goal. The tool selects only the data and the visit recordings that will be important for increasing the conversion or preventing its decrease.
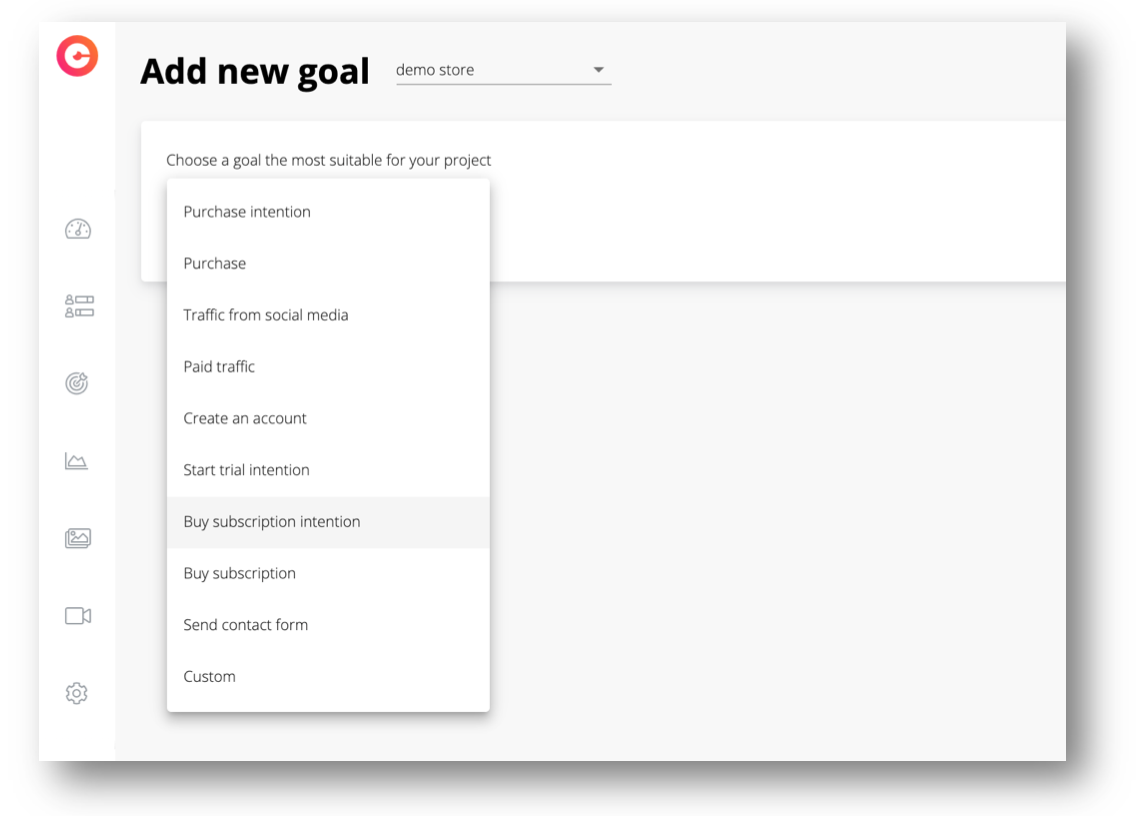
You can use ready-made, predefined goals or create your own custom ones.
3. Mapp the customer journey (Conversion Waterfall)
CUX allows you to analyze extensive conversion funnels based on any event. Watch the visits, and create funnels for that particular fragment on the page. The order of steps you set in Conversion Waterfall matters!
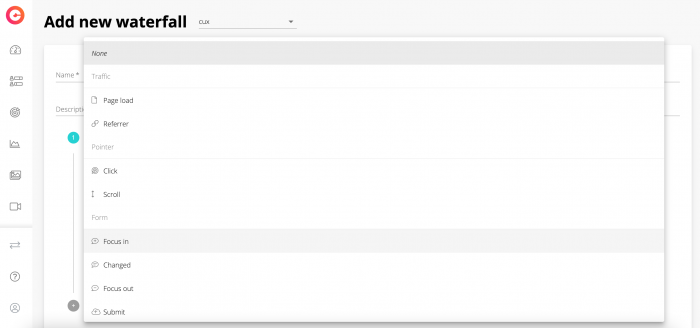
Conversion Waterfall, showing the customers' journeys, may consist of many necessary steps – remember that their order is important.
4. Track users' frustrations (Experience Metrics)
The CUX algorithm detects and defines user behavior that may inhibit conversion. Experience Metrics allows you to spot places that cause frustration and make customers drop off conversion funnels.
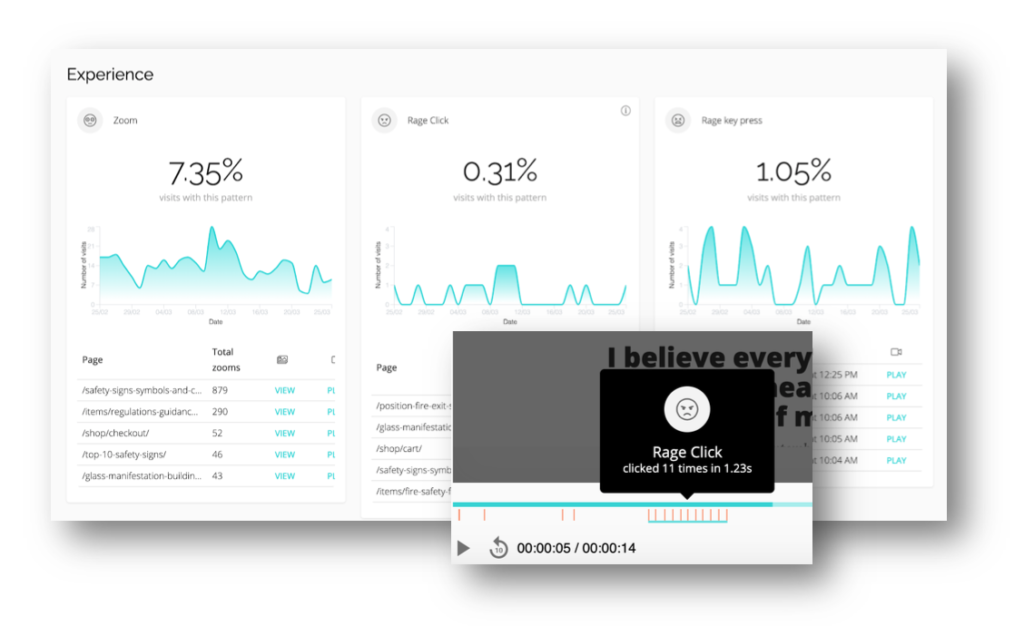
CUX selects visit recordings in which frustration and users' pain points occur.
5. Analyze users' behavior (Recordings + Heatmaps)
Visit recordings and heatmaps will allow you to visualize the customer experience. You will see places that cause frustration, find room for optimization, check the effectiveness of paid campaigns, etc.
You can filter both recordings and heatmaps.