Online forms in the digital world
The digital world revolves around web forms. Just think about it! Almost everything we do online requires us to fill out some kind of form. A simple one would be a newsletter subscription or contact form. A more robust one – asking for our feedback on a product or service.
Forms are the main conversion driving tool
Very few websites operate without web forms. To drive conversions, your users should complete the form as quickly and easily as possible.
Imperfect forms hinder conversion rates
The benefits of using online forms are plenty, but you may not reap them if your form is imperfect. These are the main shortcomings of online forms:
- The form is designed in a way that confuses the visitor
- The form takes too much time to complete
- The form requires sensitive/irrelevant information

Badly optimized forms are a common reason for low conversion and high abandonment rates. If your visitors can't fill out the form, don't want to disclose certain data, or have concerns about what will happen to their data, they are likely to leave your website, and never come back. A survey by The Manifest comprising of 502 participants revealed that 67% of users completely abandon the process of filling out the form if complications arise.
So, what is there to do? You could, of course, spend hours on fiddling with your form. Correct the perceived errors, deploy it again, only to see similarly poor results. The truth is, the only sure way for you to learn where the problems lie, is to start making use of form analytics tools. These will allow you to spot the pain points your users experience when interacting with your forms.
Why you must use an analytics tool for your web forms
First of all, what exactly does a form analytics tool do? To put it simply, form analytics tools provide you with data that reveals the behavioral patterns your users display when interacting with your forms. This allows you to easily track their journey and troubleshoot obstacles preventing users from completing the form.
What data does a form analytics tool provide
To uncover crucial information on your visitors’ interactions with the web form, a quality form tracking tool will:
- Track how many people see your form,
- Track how many of visitors who view your form actually fill it out,
- Spot the obstacles that prevent the visitor from successfully completing the form,
- Spot unnecessary elements that clutter your form, but do not engage your visitors.
With that kind of data, you can figure out exactly how to improve your forms to generate conversions.
You’d probably rather remain involved in running your business than endless split testing of your forms. In this case you need an all-in-one form analytics and tracking tool. CUX.io proves to be by far the most effective form tracking software.
Using CUX for form analysis
CUX is the UX & Analytics Automation Tool that can help you optimize your forms by showing you where you are going wrong with your form design. You can use CUX to track user behavior in your forms with heatmaps.
Why use CUX’s heatmaps for form analysis
CUX’s heatmaps tool has the advantage of visualizing different ways the visitors interact with your web form in a simple and easily digestible way. You can analyze five types of events:
- Click – This event shows places on the form your users click on. More ‘clickable’ areas are marked with yellow, orange, and red, while those areas on the form users rarely click on will be shown as green and blue.
- Rage click – This behavior is characterized by repetitive, aggressive mouse clicks and occurs, for example, when your form contains inactive buttons, which confuse the user
- Links - This event uncovers which links are clicked on most frequently, showcasing what your visitors are most interested in, and what links in your form are obsolete.
- Zoom – This event records the occurrences when visitors (only when using a mobile device) had to either zoom in or out of the form.
- Move – This event shows the movement of your user’s mouse on the form.
Even the smallest detail can make a notable difference in the conversion rates generated by your forms. And using effective form tracking software is the best way to find and fix any issues, and make them a pleasure for your visitors to interact with!
Forms are ideal analytical examples. They illustrate the fact that often only by looking at our product through the eyes of the users we’ll be able to make a quick, effective and error-free assessment of the situation. Our client from the e-commerce sector has to found out about it the hard way.
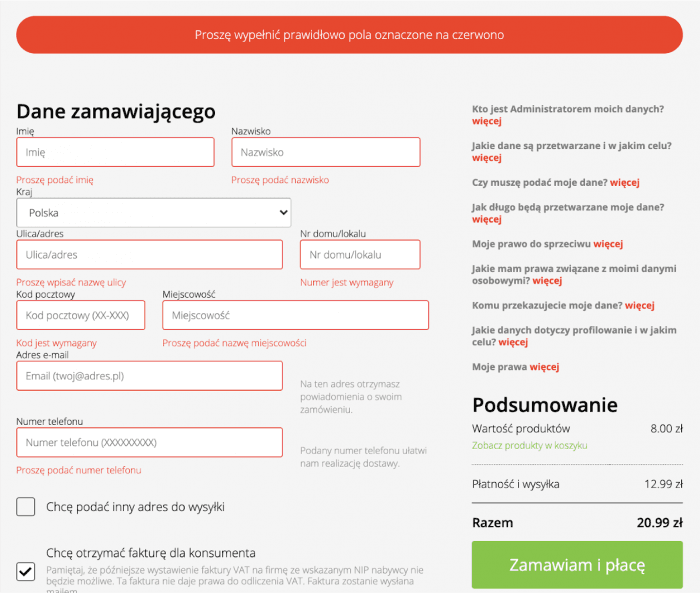
Form validation errors
The form validation message below seems to be correct – the fields marked in red need to be filled in. However, it quickly turned out that the validation itself generated basic problems. It made users abandon carts without completing the purchasing process.
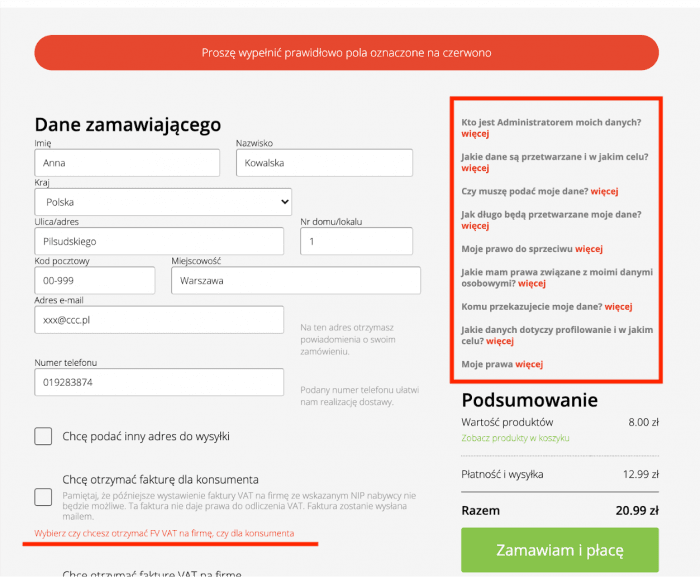
The situation appeared to be even more complicated. The errors in the form no longer applied to specific blank fields, but to unmarked checkboxes. Recordings of users’ visits clearly showed us the problem – consternation! Because the text that appeared under the checkbox was hardly visible – and of course in small red font – bewildered users, not seeing the place of the error, repeatedly and angrily clicked on the red text on the right.
Quick win
Cosmetic change
Only analytical tool focusing on the overview of user behavior patterns will be able to catch the “chaotic movements” indicator. It’s an evidence of a user being lost on the website (which in this case jumped from 0 to as much as 17%!). The introduction of cosmetic change on the form page, captured thanks to the analysis of recordings, results in even more than 20% increase in customer conversion!
Quick win – a solution that immediately eliminates the consumer’s problem – in this case was the introduction of small visual corrections on the form page. Changing the colors of individual fonts, emphasizing the need to check certain checkboxes. Thanks to quick wins, the client was able to quickly spot the problem and address it before the conversion rate would drop irreversibly.
QUICK WINS are quick solutions that immediately respond to the needs of your online consumers. Deployments do not require significant resources, implementing takes up to maximum 60 days. Although most implementations can be carried right then and there. Quick wins are based on the constant observation of analytics metrics and customers’ behaviors. Thanks to analytics, we’re able to choose the right solutions that allow us to make business decisions based on data, and not on the intuitions or stakeholders’ wishes.
Quick wins in brief:
- do not require expenses (or generate only small costs)
- carry a low risk,
- easily accepted by business,
- recognized on the basis of data,
- results warranted,
- improvements can be implemented in max. 60-90 days,
- the project team can implement them autonomously.
Contact with the client is a priority
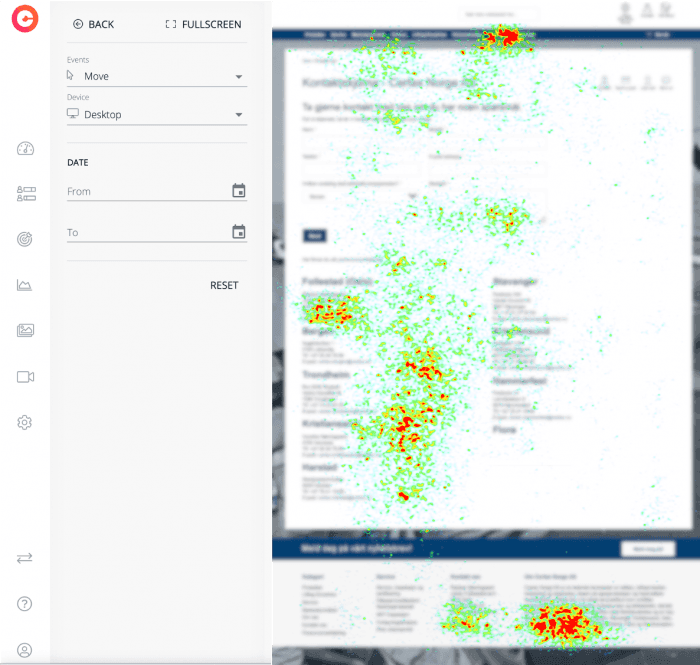
Our client from the metallurgical industry has recently found about the importance of building changes and introducing quick wins based on the expectations of our own customers. His goal – during the redesign of the current website – was to make it easier for customers to contact his company. Most of the large and significant orders for him were based on direct contact, so the contact form clarity was obviously his business biggest priority.
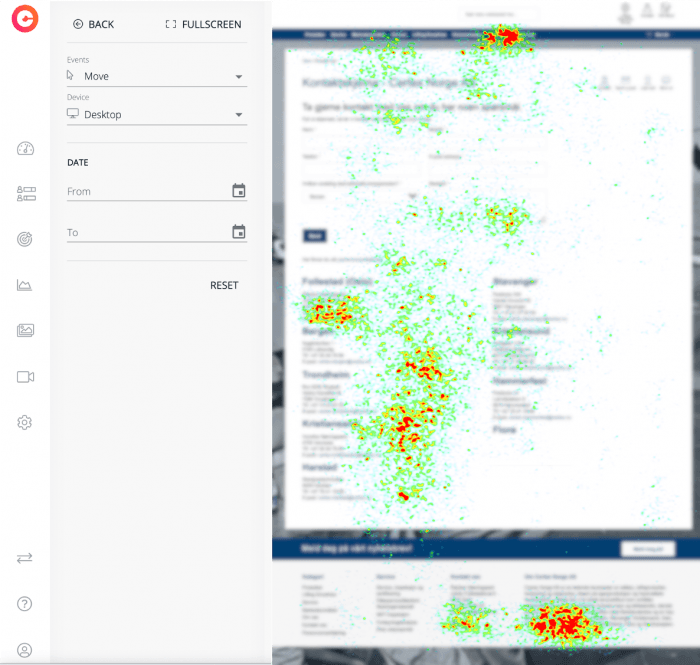
Presently – in the activities he was relatively satisfied with so far – the exposed form of contact on the customer-producer line was the form. However, the analysis of the heatmap data and the measurement of the business target fulfillment indicator showed that only 12% of customers go to the form page, and only 0.3% of them actually fill it in. In addition, the heatmap presenting the movements on the form page itself clearly showed that customers had skipped the fields with the form and their attention was drawn immediately to addresses, telephone numbers and e-mails.
Quick win
Simplify the contact page
The use of an analytical tool such as CUX allowed not only to discover a problem that the entrepreneur had not known about so far, but it also led to implementation of a solution that significantly increased his conversion (in this case, direct contact with the customer). Thanks to the simplification of the contact page, customers began to find the information they needed faster and the barrier in the form of… well, a form was eliminated. Such quick and simple implementation of changes is a perfect example of the impact of quick wins on the business potential of many companies.
QUICK WINS are quick solutions that immediately respond to the needs of your online consumers. Deployments do not require significant resources, implementing takes up to maximum 60 days (although it can be implemented right then and there). Quick wins are based on the constant observation of analytics metrics and customers’ behaviors. Thanks to analytics, we’re able to choose the right solutions that allow us to make business decisions based on data, and not on the intuitions or stakeholders’ wishes.
Quick wins in brief:
- do not require expenses (or generate only small costs)
- carry a low risk,
- easily accepted by business,
- recognized on the basis of data,
- results warranted,
- implemented in max. 60-90 days,
- the project team can implement them autonomously.