May 4, 2026
14 min read
The data-driven customer journey map: How to see your business through your users' eyes
Most companies think they know how customers move through their site. They track visits, clicks, and conversions. They draw diagrams with neat arrows connecting awareness to purchase. Then they wonder why conversion rates don't improve. The problem isn't the data, but what's missing from it.

Agata Olbrycht
Content Strategist @ CUX

If your customer journey map is built on internal assumptions instead of real customer journey data, it's probably hiding your biggest conversion problems. The companies in this guide used customer journey analytics, combining behavioral, qualitative, and quantitative data, to find what traditional dashboards missed, and saw results ranging from 5x ROAS to a 50% lift in purchase intent. Below is the exact framework for building a data-driven customer journey map that works the same way.
TL;DR:
- Traditional analytics show where users go but miss why they hesitate, leave, or convert
- A data-driven customer journey map combines three data layers: quantitative metrics, qualitative insights, and behavioral analytics
- Real examples show how customer journey analysis delivered 5x ROAS for a retail brand and a 50% lift in purchase intent for a B2B insurer
- This guide covers how to build, present, measure, and iterate a journey map grounded in real customer journey data
Traditional analytics show where users go, but not why they hesitate, what confuses them, or when they're actually ready to buy. Customer journey mapping turns behavioral signals into business results: higher ROAS, better conversions, and decisions based on reality instead of assumptions.
Here's how to build a customer journey map that helps you make better business decisions.
What is customer journey mapping and why does it matter
A customer journey map is a clear picture of how people interact with your brand, from the first spark of interest to the final decision. It helps you understand what draws them in, what slows them down, and what convinces them to take the next step.
Every company has a version of this story.
In B2C, the journey can unfold in minutes: someone sees a product on Instagram, adds it to the cart, checks delivery options, then gets distracted and returns days later to finish the order.
In B2B, the same path stretches over weeks or months, crossing demos, internal approvals, and budget meetings. Each journey looks different, yet both depend on the same thing - understanding behavior.
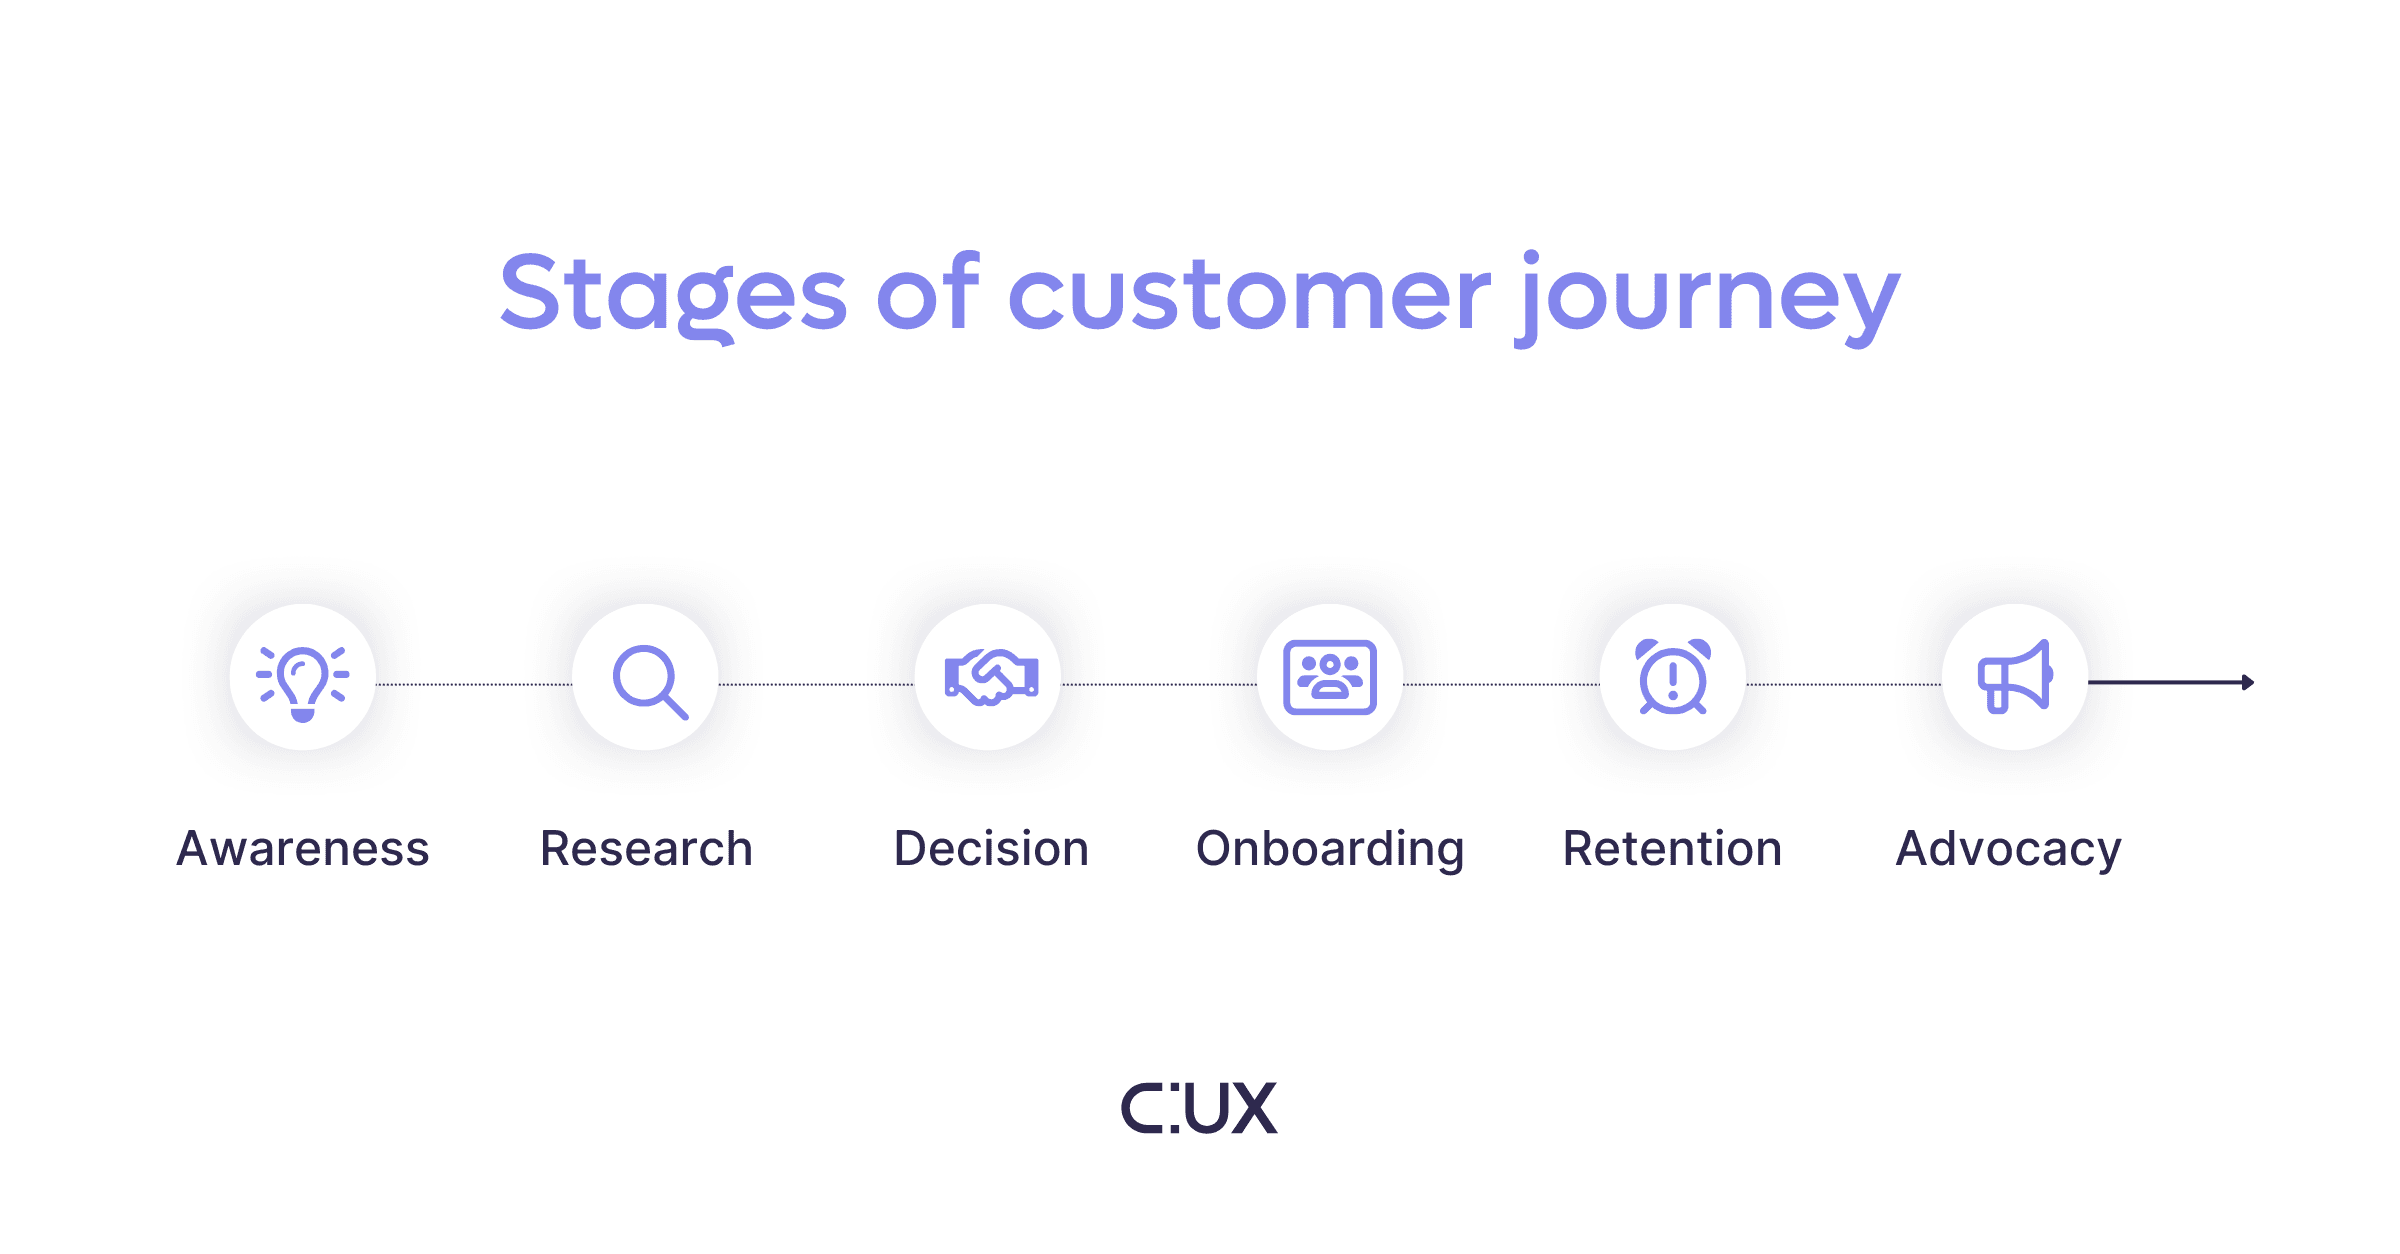
Stages of a customer journey
Most journeys follow similar stages - awareness, research, decision, onboarding, retention, and advocacy - yet no two unfold the same way. Mapping them helps teams compare the ideal path they plan for users with the actual one revealed by data. The gaps between those two stories often hide the biggest opportunities for growth.
From static maps to real-time customer journey analytics
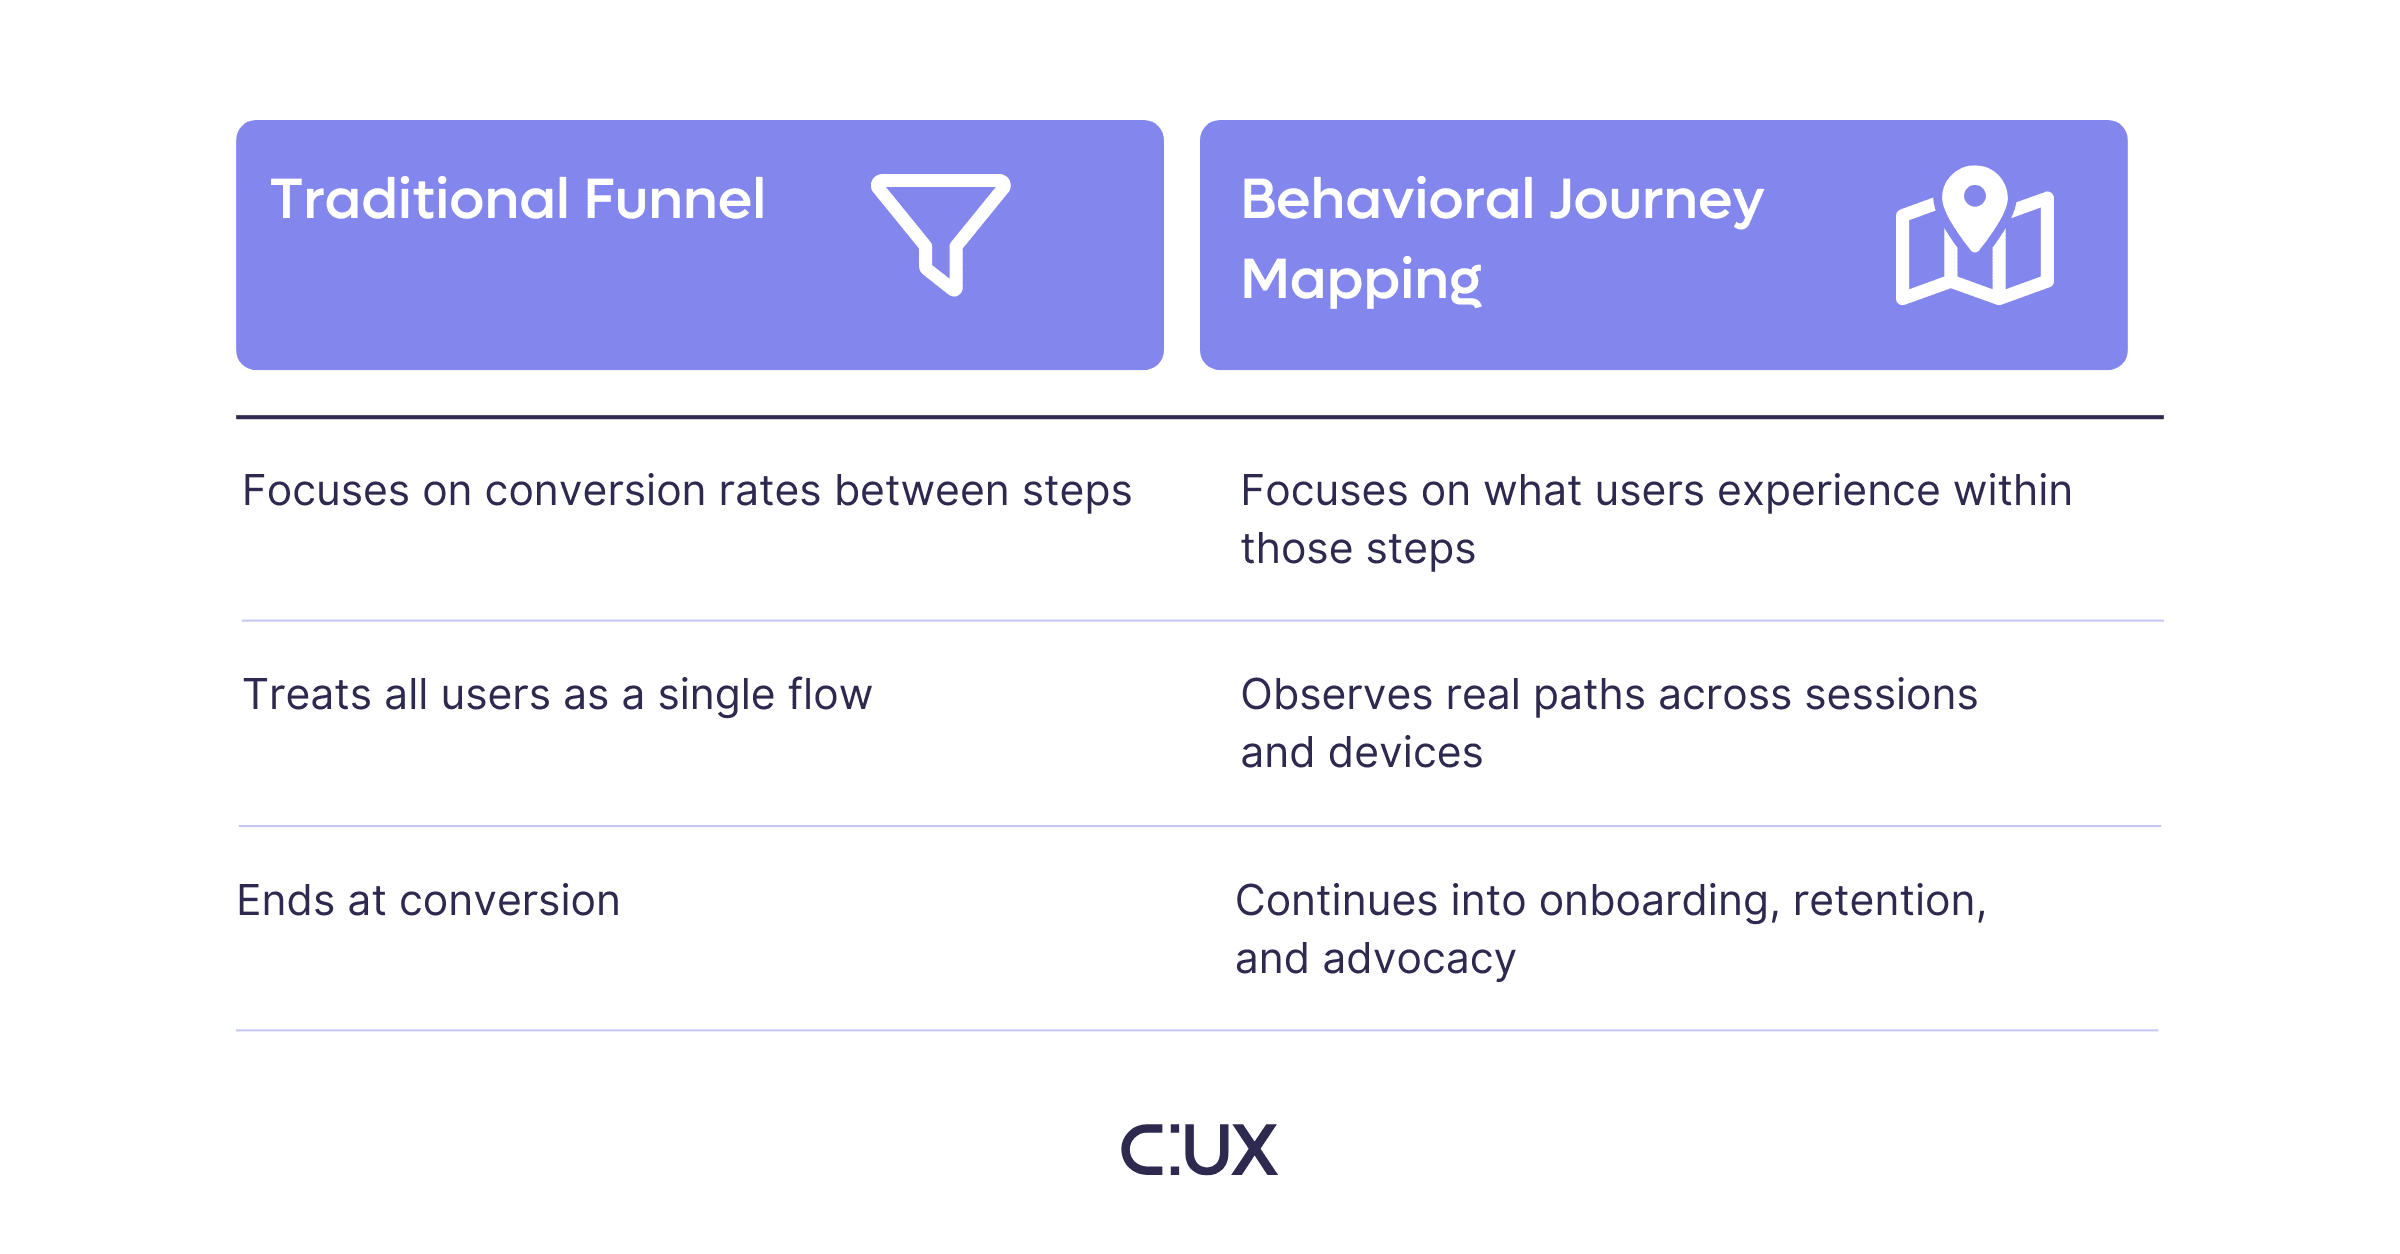
Traditional journey maps try to capture that flow, but most stay on the surface. They list touchpoints - awareness, consideration, purchase - without showing what actually happens in between. These maps help start conversations, yet they rarely explain why users leave a page, pause mid-checkout, or switch devices halfway through.
Modern customer journey mapping goes further. It blends customer journey data from multiple layers: quantitative metrics that track movement, qualitative insights that reveal intent, and behavioral analytics that show what people actually do.
When you work from this kind of data, a customer journey map shows what users experience in real time and helps your team make decisions grounded in reality.
The three layers of data in customer journey mapping
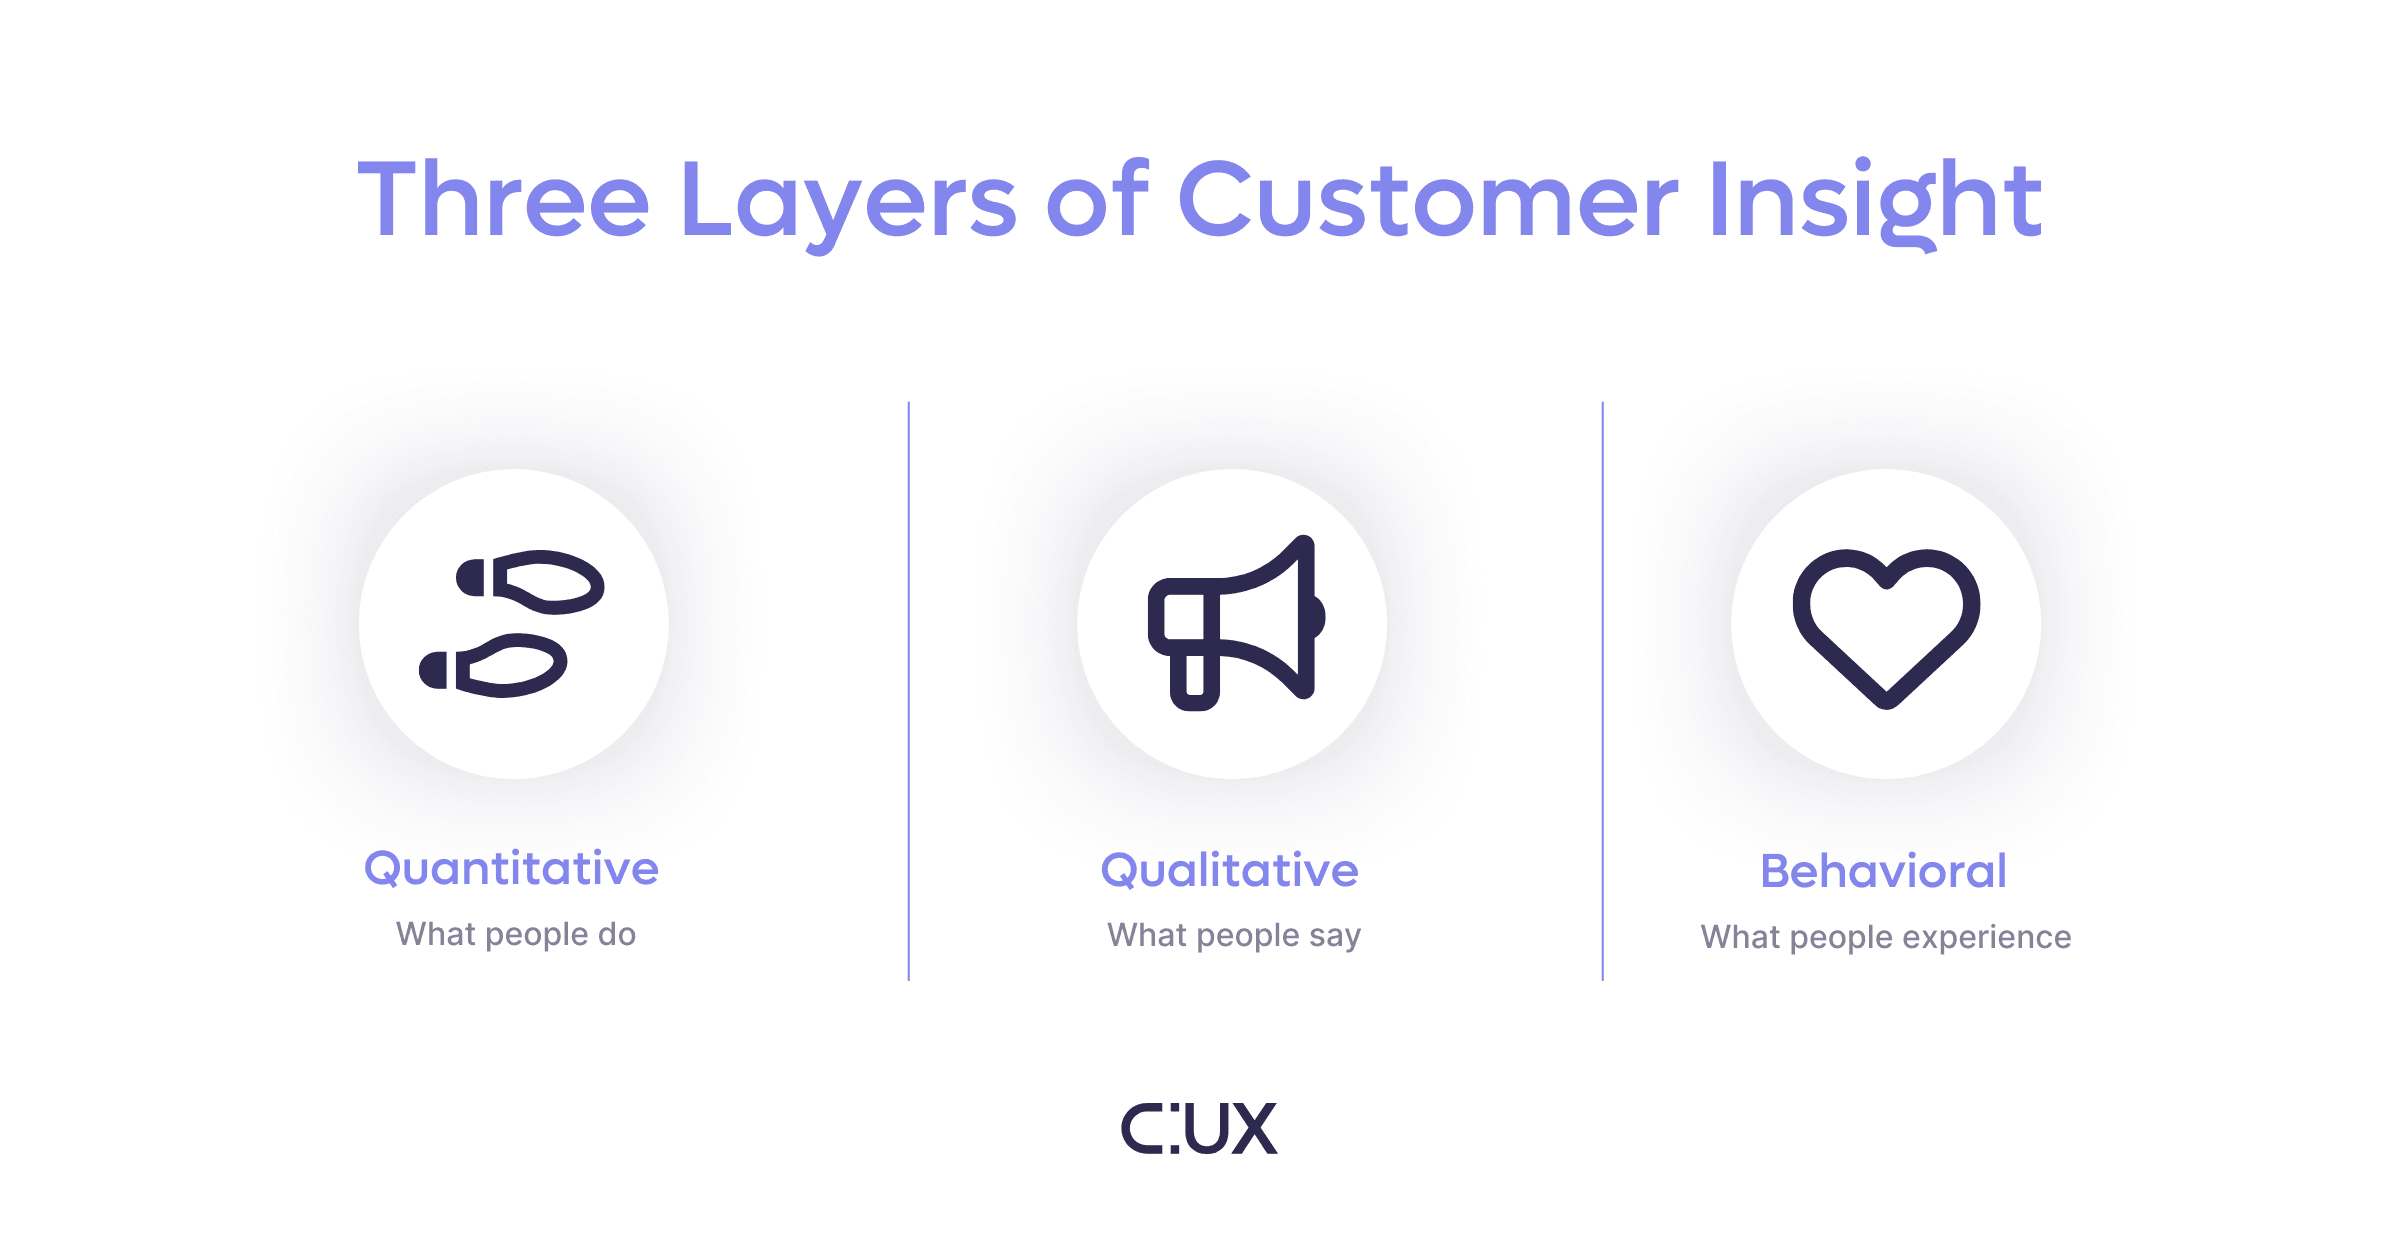
A strong customer journey map is built on real data, not guesswork. To get the full picture, you need three layers working together: what users actually do, what they tell you, and what happens moment by moment as they navigate your product.
Quantitative – what people do
Start here. This is your foundation: traffic sources, clicks, time spent on pages, conversion rates. A customer analytics platform captures these patterns and shows you exactly where people move through your site and where they drop off. It gives you the big picture: direction and scale.
Qualitative – what people say
Now bring in the human element. Surveys, interviews, chat transcripts. This is where you hear directly from users. They tell you why they came, what frustrated them, what they expected to find. These insights reveal the motivations and emotions behind the numbers, adding crucial context you cannot get from data alone.
Behavioral – what people experience and why they take actions
This is where things get interesting. Behavioral analytics tools let you watch real interactions unfold: every click, scroll, repeated action, and moment of hesitation. These experience metrics show you both what happens and why it happens.
You might see users clicking on product photos expecting details to open, or returning to the same checkout step five times in a row. These signals reveal the reasoning behind user actions and show you exactly where the experience breaks down and where improvement is needed the most.
Together, these three layers turn a customer journey map into a precise reflection of reality. Each layer adds clarity: quantitative shows the path, qualitative explains intention, and behavioral reveals experience and motivation.
Who builds and uses the map
Each layer speaks to a different team. Marketing draws on behavioral signals to refine campaigns, product uses them to improve usability, and customer success reads them to prevent churn.
The most effective journey maps grow from this collaboration, with every department contributing a different piece of the picture.
Behavioral analytics in action: Real examples
The best way to understand customer journey mapping is to see how it works in practice. Let’s look at two very different journeys - one in retail, one in B2B services - where behavioral data changed not just what teams saw, but how they made decisions.
Example 1. Retail customer journey – Turning behavior into 5× ROAS
A leading clothing brand wanted to make their remarketing campaigns more efficient. Standard analytics showed visits and purchases but gave no clue what happened in between - how intent built over time, what users looked for, or when they were ready to buy.
Using CUX, the team finally saw the full path.
Visit recordings and heatmaps revealed that most customers didn’t buy immediately. They added items to the cart as a wishlist, left, and returned an average of three times before completing the purchase. The cart acted more as a planning tool than a checkout step.
The data also showed that 8% of buyers used the internal site search right before purchase - a strong behavioral signal of intent. Those users knew what they wanted; they were simply checking details before buying.
These findings changed the marketing strategy completely. Instead of targeting every site visitor, the team focused on:
- Users who had visited the site three or more times, and
- Audiences whose past searches revealed clear buying intent.
Remarketing messages were timed later in the customer journey and matched the exact product terms users had searched for.
The results were clear:
- 5× higher return on ad spend (ROAS).
- Lower wasted budget, as ads reached visitors most likely to convert.
- Higher engagement, with users responding to content that reflected their real behavior.
Behavioral data turned what had been broad, repetitive advertising into focused communication - one that reached customers at the right moment and spoke to what they actually cared about.
Example 2. B2B customer journey - Simplifying complexity in insurance
An insurer’s website had grown dense and confusing over time. The team relied on traffic and form metrics but couldn’t tell why leads were poor or why visitors kept dropping off. They needed to see how users actually navigated, and where they got lost.
Behavioral analytics filled that gap. Recordings and heatmaps showed visitors skipping key content on the homepage and defaulting to the main navigation in search of clarity. Users weren’t ignoring the offer - they couldn’t find it.
Armed with this evidence, the marketing and UX teams redesigned the homepage around real behavior:
- Simplified structure and scannable content.
- Clear calls to action: “Buy Policy” and “Request a Call.”
- Visual hierarchy focused on customer priorities.
After the rollout, customer journey data told a very different story:
- +15% more visitors reached product subpages.
- “Buy Policy” clicks rose from 3% to 4.5–5% - a 50% lift in purchase intent.
- Lead form conversions climbed from 0.84% to 1.2% - a 37% increase in qualified leads.
Behavioral analytics turned assumptions into proof. Instead of debating what users might want, the team could act on what they actually did.
Beyond single sessions: multi-device and segment insights
User journeys rarely fit into one visit or one device. A shopper might browse products on mobile, then return on desktop to check delivery options or finish payment. A business client might start an inquiry on desktop, open a follow-up email on mobile, and revisit the quote from a tablet days later.
Behavioral analytics connects these touchpoints into one continuous story. It shows how intent builds across visits, where users pick up, what repeats, and what finally triggers action.
The same data also reveals how different segments move through the journey. First-time visitors read more and hesitate longer; returning users act faster but expect consistency. When forms, layouts, or offers differ across devices, confidence drops. Seeing both paths side by side helps teams design smoother, more predictable experiences. Across industries, the principle stays the same: behavioral data turns static maps into living models.
For retail, it sharpens timing and relevance. For B2B, it exposes complexity and simplifies decision paths.
In both cases, it shifts customer journey mapping from a design exercise to a foundation for growth.
How to defend and present your customer journey map
A customer journey map becomes valuable only when others understand it. Presenting it well means showing what the data reveals, how it affects results, and why it matters for growth.
Start with what people can see
The fastest way to gain attention is through evidence. Begin with a short visit replay or a visual snippet from your behavioral analytics tool. Show a real user trying to complete a task. A moment of hesitation or confusion instantly explains the problem.
Numbers often stay abstract. Seeing real behavior builds empathy and makes the data memorable. Stakeholders start connecting performance metrics with actual user experience.
Explain what each finding means for the business
For every insight, connect the behavior to measurable outcomes. When you explain that simplifying navigation sent 15% more visitors to product pages, or that a clear CTA raised purchase intent by 50%, the value of your customer journey map becomes obvious. Each behavioral change links directly to results.
This approach turns data into a shared language across teams. Marketing sees how clarity improves conversion. Product teams understand which interactions block progress. Leadership recognizes how these small adjustments influence revenue.
Present behavioral data as ROI evidence
Executives care about results - revenue, retention, efficiency. Use customer journey data to show how improved flows reduce costs and increase performance.
- Fewer drop-offs mean higher conversion rates.
- Clearer journeys shorten sales cycles.
- Targeted engagement improves ad performance and lead quality.
Behavioral insight supports financial logic. It shows how journey mapping aligns with the company’s goals and demonstrates the link between user experience and business growth.
Journey mapping vs. traditional funnels
This is where behavioral mapping separates itself from traditional funnel analysis.
By aligning these behavioral insights with CX KPIs or team OKRs, such as conversion lift, churn reduction, or adoption rate, companies can measure the journey’s impact beyond design improvements.
Make the journey map part of decision-making
Treat the map as a living reference, not a finished report. Add it to product reviews, marketing retrospectives, and growth discussions. Keep it active by updating it with new insights. Every pattern you uncover brings another layer of precision to your journey orchestration process.
Teams that use the map regularly start planning around real behavior instead of assumptions. They decide based on what customers experience, not on what internal reports predict.
Turn presentation into alignment
A well-presented customer journey map connects everyone to the same goal: a better understanding of the customer. Once stakeholders see how user behavior translates into measurable business effects, the conversation changes. The map becomes more than a visualization - it becomes a tool for collaboration, growth, and shared accountability.
How to measure and iterate a data-driven customer journey map
A customer journey map works best when it stays alive. User behavior changes with every new campaign, product update, or market shift, and the map should reflect that reality.
Teams that keep their journey map up to date treat it as part of their analytics routine. They check it when conversions dip, when a new feature launches, or when customer sentiment starts to change. Each review turns scattered feedback into action.
The process is simple:
- Revisit the map regularly. A quarterly review keeps insights fresh without overloading teams.
- Compare key metrics over time. Look at conversion rate, task success, drop-off points, or time to purchase.
- Validate improvements with behavior. When a fix goes live, watch session recordings to confirm that users now move smoothly through the path.
Behavioral analytics also reveal small signals worth tracking - a rising number of returning visitors, shorter hesitation on pricing pages, smoother onboarding flows. These details show progress that traditional analytics might overlook. Every iteration makes your data-driven customer journey map sharper. Instead of reacting to problems, teams start anticipating them. The map becomes less a report and more a habit - a steady rhythm of observing, learning, and refining based on what users actually do.
Moving forward with customer journey mapping
Customer journey mapping is a continuous process of watching, learning, and adjusting based on real behavior. The teams that do this well don't wait for problems to appear in their metrics - they see friction building and fix it before it costs them customers.
Start with one layer of data. Add behavioral analytics. Connect the dots between what users do and what drives revenue. The insights you uncover won't just improve your customer journey, but change how your entire team makes decisions.
FAQs
Q: Why do you need three data layers for customer journey analytics?
A: Quantitative data shows where users go. Qualitative data explains why they came. Behavioral data reveals what they actually experience along the way. Customer journey analytics combines all three because no single layer tells the full story. Traffic numbers miss intent, surveys miss real-time behavior, and session recordings without context miss scale. The three layers together turn a static map into a tool teams can act on.
Q: How is the B2B customer journey different from B2C?
A: The B2B customer journey typically involves longer timelines, multiple decision-makers, and stages like demos, internal approvals, and budget reviews. B2C journeys tend to be shorter and more emotionally driven. Both rely on the same principle - understanding behavior - but a B2B customer journey requires tracking interactions across more touchpoints and over weeks or months rather than minutes.
Q: What are the best tools for customer journey analysis in 2025?
A: The best tools for customer journey analysis 2025 go beyond heatmaps and pageview dashboards. Look for platforms that capture full user sessions, visualize real conversion paths, and surface behavioral signals like hesitation, rage clicks, and repeated actions. The best dashboards for customer journey analysis connect this behavioral data to business outcomes — conversion lifts, churn reduction, and revenue impact — so teams can act on evidence rather than guesswork.
Q: How do you track the customer journey across devices on a website?
A: The website customer journey often spans multiple devices - a user might browse on mobile, compare on a tablet, and convert on desktop. To track this, you need analytics that connect sessions into one continuous path rather than treating each device as a separate visit. Look for tools that stitch customer journey data across touchpoints so you can see where intent builds, where users pick up, and what finally triggers action.
Q: What is customer journey mapping analysis?
A: Customer journey mapping analysis is the process of examining a journey map against real behavioral data to find gaps between the intended experience and what users actually do. Instead of treating the map as a finished artifact, teams revisit it with customer journey data analytics - recordings, conversion waterfalls, and segment comparisons - to validate assumptions and prioritize fixes that affect business results.