May 26, 2022
8 min read
What is a rage click?
Click, click, click, clickclickclickclickclick… and nothing happens. You just received a shorthand definition of a rage clicks.

Kamila Kotowska
Head of Growth at cux.io

What is a rage click?
And when user frustration prevails?
Ever found yourself furiously clicking on a webpage with no response? It's so annoying, right? That's what we call a "Rage Click." It's a big red flag showing us exactly where a website is letting users down and sparking their frustration.
In brief, rage clicks are records of user frustration. We've taught our algorithms to show you every event, that happened on your site, which resulted in people clicking numerous times and getting no computer response. Why? Because those are your users who are experiencing something that's referred to as computer rage — the state of anger and angered actions directed against computers.
Rage click is never a good sign, especially if we talk about user experience. When you ignore them, you risk increasing customer churn. But they can also be your guardian angels, leading you gently to the gates of QUICK WINS for your website. When you note them in the visits, use them to prioritize future design and development work. Use this as your chance to turn observations into actionable items and frustrated users into happy ones.
Why do you detect rage clicks?
Rage clicks can be a bottomless mine of knowledge about customers' behavior. They appear whenever your website evokes negative emotions. They identify places that mislead visitors. These can be fragments of text that look like links or calls to action. These can be images that look like banners. Or simply dead links or buttons that don't work.
Sometimes things that aren't obvious to us to be clickable to someone can be the source of a tremendous number of rage clicks or other analytics metrics. The key is to take some action – track, identify, and turn them into quick wins of a better customer experience.
How can I use rage clicks to improve customer experience?
You can use them to identify unresponsive pages. In general, you can find out if the performance of your website degrades the user experience. They can also apply to web design – you can look at whether the size of your images is optimized or if people are clicking on them, hoping to witness an enlarged version. Through the rage clicks, you can easily track partially loaded images. People click on them, expecting to view the graphics in full.
By analyzing user behavior, you’ll understand why your customers get angry when they visit your site and how their unexpected frustration is effectively inhibiting your conversion.
Tracking rage clicks tools {/#tracking-rage-clicks-tools}
On the market, you can find a lot of analytical tools that let you track rage clicks and other customers' pain points on your website. This is a chance (of course, with proper analytics) to turn those metrics into actionable items and improve your customers' user experience.
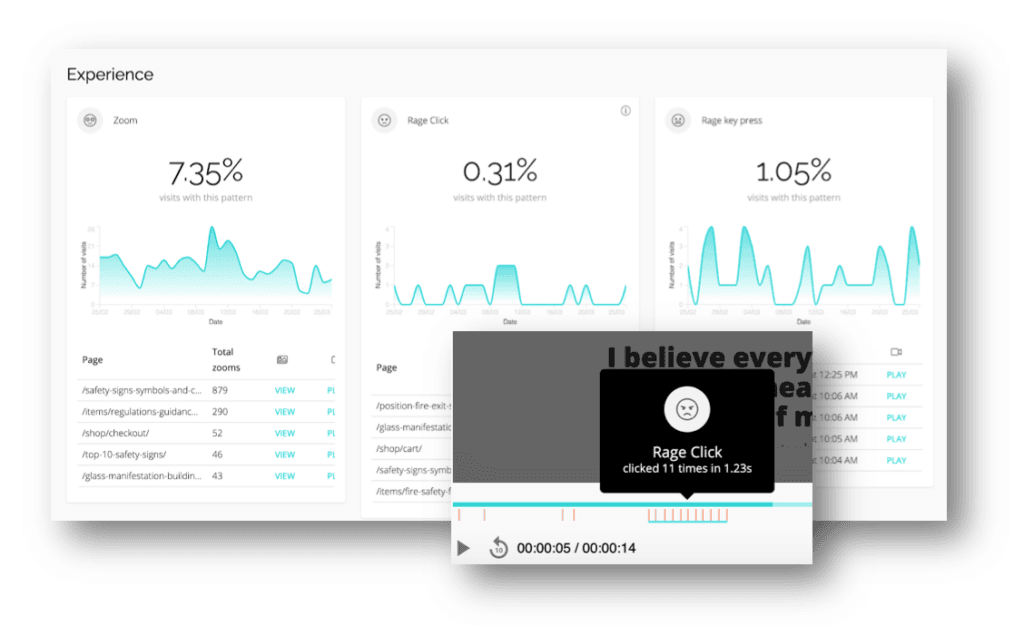
One of the tools is CUX.io. First UX & Analytics Automation tool that recognizes, detects and defines the behavioral patterns of your users. One of CUX's main features is Experience Metrics. This will allow you to analyze what stops your customers from buying, and sorry for being completely honest, you will discover what kills your sales. 😥
Based on gathered data, and analysis of Visits Recordings, you will get many constructive conclusions that will lead you to a better User Experience and (cross fingers) improve your sales. 😎
What can I measure with CUX's Experience Metrics?
- Rage clicks
- Rage key pressing
- Zooming
- Chaotic Movement
Learn more about Experience Metrics by watching our YouTube tutorial.
How can I track rage clicks?
In this article, we show you how to track rage clicks in CUX, the very first UX & Analytics Tool.
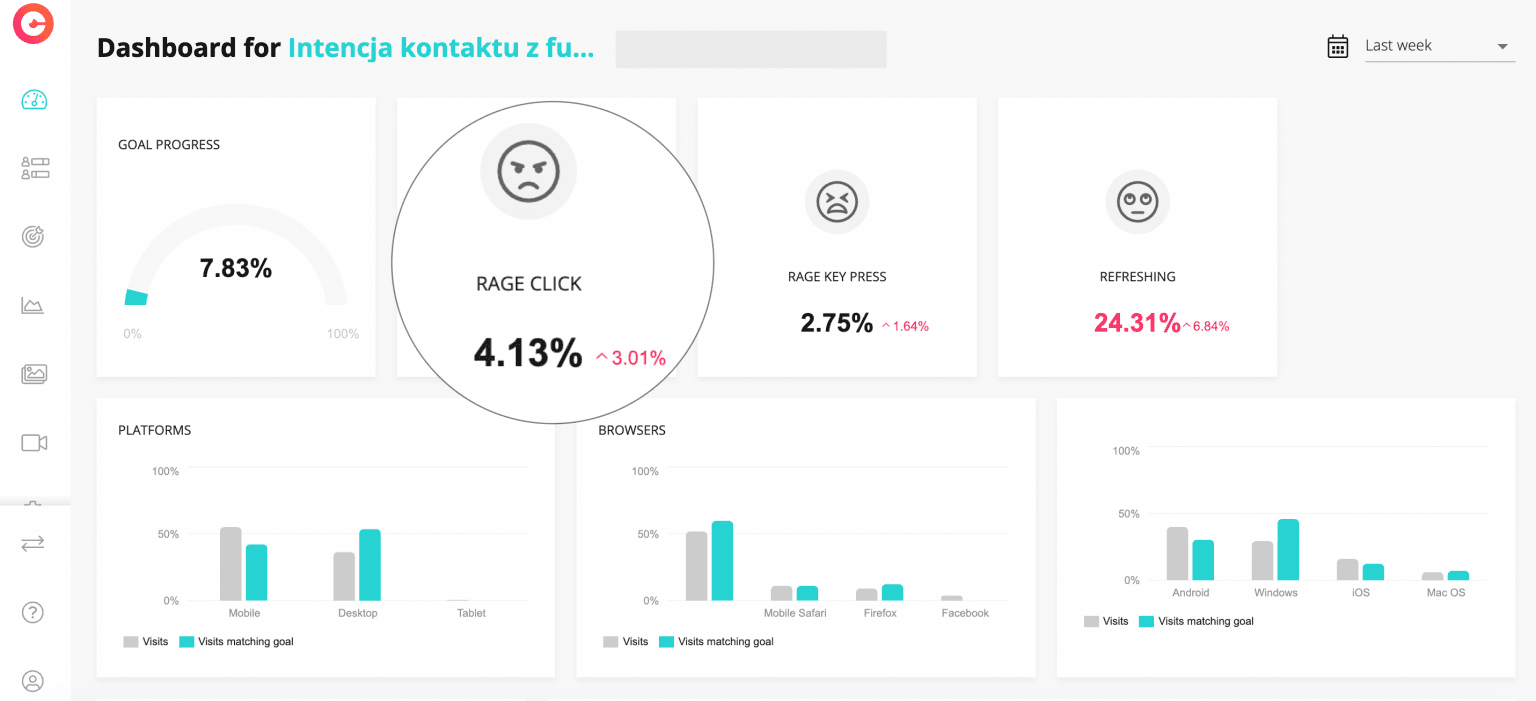
Option 1: Dashboard
Rage clicks strike the eye whenever you log in to your CUX account. There's a special widget you should notice by default on your dashboard. This shows the number of visits – that have reached your main Goal – with rage clicks recorded. Next to it, you'll also spot that there other Experience Metrics like rage key presses, zooming, or refreshing in context of your Goal.
Option 2: Visit Recordings
You'll see them whenever you decide to watch your visits recording. You can filter the list of visits and use a rage click as a parameter.
To see visits where rage clicking happened:
- Click Open filters on the Visits page.
- Find the Patterns section.
- From the patterns list, select Rage click.
- Click Apply to see the list of select recordings.
- The list of recordings automatically updates. You can then click Play for each visit and find out where exactly user frustration occurs. You can also apply one of our predefined segments on selected recordings, e.g., traffic from mobile or evening traffic.
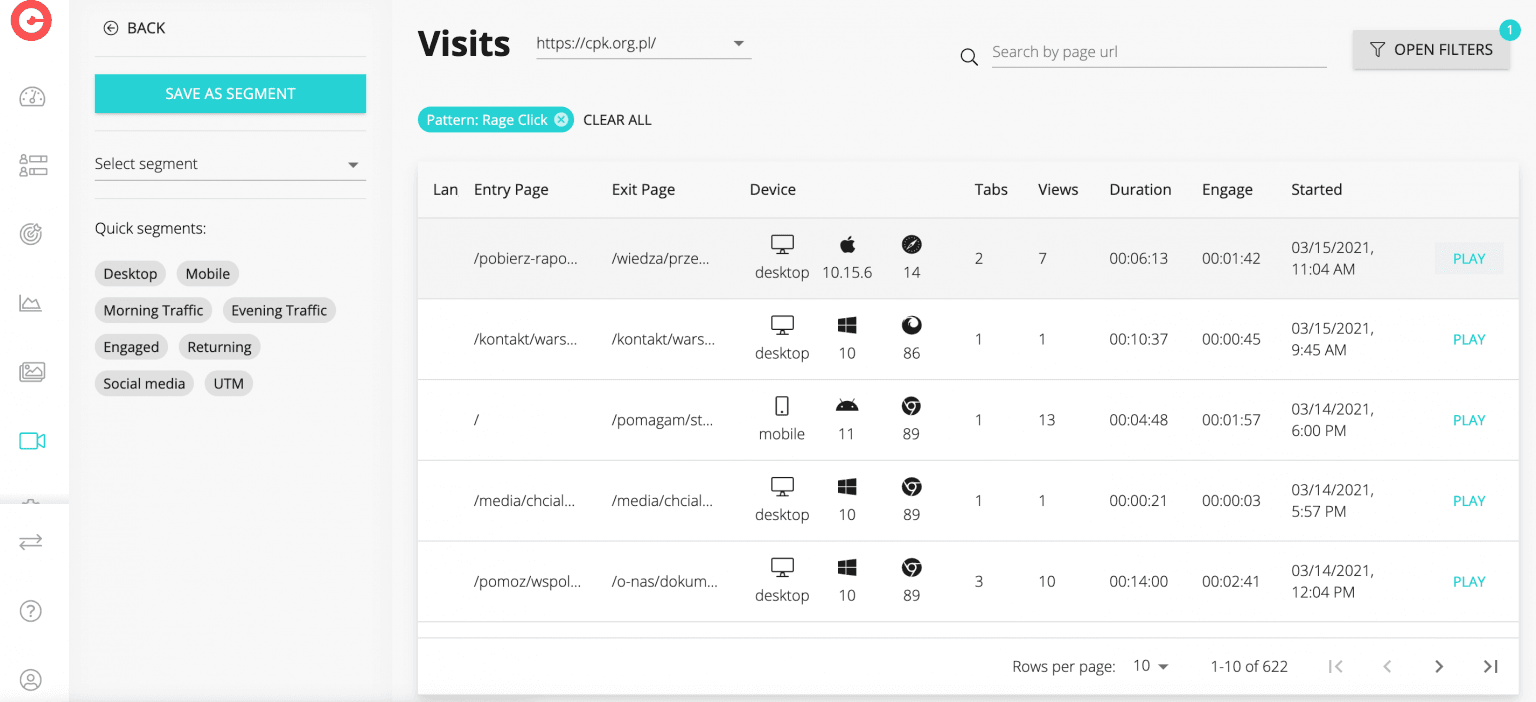
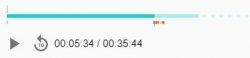
Each recording has a color marker below the player timeline. You can fast-forward the recording to take some details.
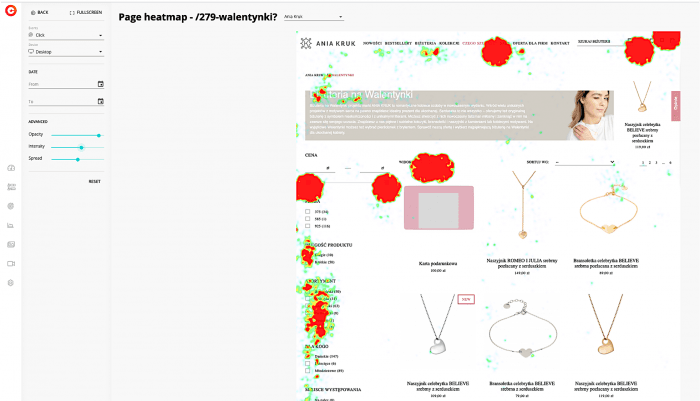
Option 3: Heatmaps
Whether you decide to work on a single or grouped heatmap – you'll be able to spot rage clicks. Each heatmap allows you to see a specific type of event, and rage click is one of them. On the heatmap, you can also switch the device type to see, for example, whether angry behavior happens on mobile devices as well.
Why do rage clicks mean quick wins?
Rage clicks are essential in analyzing user behavior on your website. Why? Because they can easily lead you to quick wins – whether it concerns optimization of marketing campaign, form filling, or rescuing conversion drops. You just have to identify them.
Rage click shows where people click numerous times and get no computer response. In effect, they experience something that’s referred to as computer rage — the state of anger and angered actions directed against computers.
In brief, rage clicks are records of user frustration. For your pages rage clicks show:
- Design imperfections
- Implementation errors or bugs
Rage clicks are never a good sign. When you ignore them, you risk increasing customer churn. When you note rage clicks in the visits, use them to prioritize future design and development work. Use this as your chance to turn observations into actionable items.
Why it’s essential to hunt for rage clicks?
- You can see if your site evokes negative emotions.
- You can identify places that mislead visitors. These can be fragments of text that look like links or calls to action. These can be images that look like banners.
- You can find out dead links or buttons that don’t work.
- You can identify unresponsive pages. In general, you can find out if the performance of your website degrades the user experience.
- You can learn if images embedded on your site are optimized. Perhaps people click on them, hoping to see an enlarged version?
- You can track partially loaded images. People click on them, expecting to see the graphics in full.
Where can I track rage clicks?
On the dashboard
We have prepared a special widget that shows the number of rage clicks that we’ve recorded on your site. You should see this tile by default on your dashboard. When you place it on the dashboard, it shows you the number of visits with rage clicks recorded. You can click this tile and land on the Visits page that shows all recordings with rage clicks.
When you filter or watch visits
You can filter the list of visits and use a rage click as a parameter. To see visits where rage clicking happened:
- Click Open filters on the Visits page.
- Find the Patterns section.
- From the patterns list, select Rage click.
- Click Apply to see the list of select recordings.
The list of recordings automatically updates. You can then click Play for each visit to find out where exactly user frustration occurs.
Each recording has a color marker below the player timeline. You can fast forward the recording to see the details.
On the heatmap or a grouped heatmap
Each heatmap allows you to see a specific type of event, and rage click is one of them. To see heatmaps for visits with rage clicking:
- Go to Heatmaps.
- Open a heatmap with traffic from mobile devices.
- Find the Events section.
- From the events list, select Rage Click. Heatmap will generate automatically.
Note that we’ll not always be able to show you a heatmap for a specific event due to not enough data gathered.
In the Experience Metrics section
In the app, you will also find the Experience Metrics section, where you will see all visits (not only those achieving your Goal, such as on the dashboard), in which a given user frustration occurs: zooming, rage click, rage key presses, chaotic movement or refreshing.
Ready to take some sweet action on smarter analytics and UX automation? Drop us a line at team@cux.io, or you can try a trial version of CUX!