March 31, 2026
9 min read
Your mobile app may be losing users right after release - mobile analytics shows why
Standard reports hide the real story, but behavioral mobile analytics reveals exactly why users leave. Check your app engagement metrics in CUX today to stop the "deploy and panic" loop for good.

Agata Olbrycht
Content Strategist @ CUX

Mobile analytics helps teams understand how users interact with a mobile app after installation. It includes tracking engagement, retention, feature adoption, and behavioral signals such as hesitation, repeated taps, or abandoned flows inside the app interface.
Key insights
- Standard mobile app analytics shows what happened but rarely explains why users abandon a feature after release.
- Behavioral mobile analytics reveals interaction patterns such as hesitation, repeated taps, or abandoned flows.
- Visit recordings and gesture heatmaps help teams detect friction immediately after deployment.
- Catching these signals early prevents the “deploy and panic” cycle.
In the high-stakes world of enterprise mobile analytics, whether in banking, travel, or e-commerce, there is a standard operational cycle that has silently become the norm. It is expensive, stressful, and inefficient.
We call it the "Deploy and Panic" loop.
The cycle looks like this: A company deploys a major feature. They wait. KPIs drop. Panic sets in. Teams scramble to analyze the data. Finally, after days or weeks of bleeding revenue, a hotfix is deployed.
In 2025 and going into 2026, relying on this reactive model no longer works for organizations that depend on mobile user acquisition for growth. It creates a massive gap between deployment and insight, and in that gap, you lose your users.
Mobile analytics reality: why basic app performance metrics aren't enough
Why does this cycle persist? Market insights show something counterintuitive: companies collect more data than ever, but the picture gets blurrier.
Analytics teams often jump between crash reporters, product analytics, heatmaps, and BI dashboards. Many organizations combine multiple mobile analytics tools to monitor performance and engagement. However, when these tools focus only on events or crash reports, they miss the behavioral signals that explain why users struggle during a release.
Each tool focuses on a different slice of reality, like technical stability, events, funnels, or visual patterns. When these streams don’t connect, stakeholders judge a rollout based on incomplete context and miss the moments where user behavior actually shifts.
And “losing a user” looks different than it used to.
The real threat doesn’t come from a total app failure, but from the small interactions that standard mobile apps metrics overlook - a toggle that blends into the background, a button that feels inactive, a label that misleads.
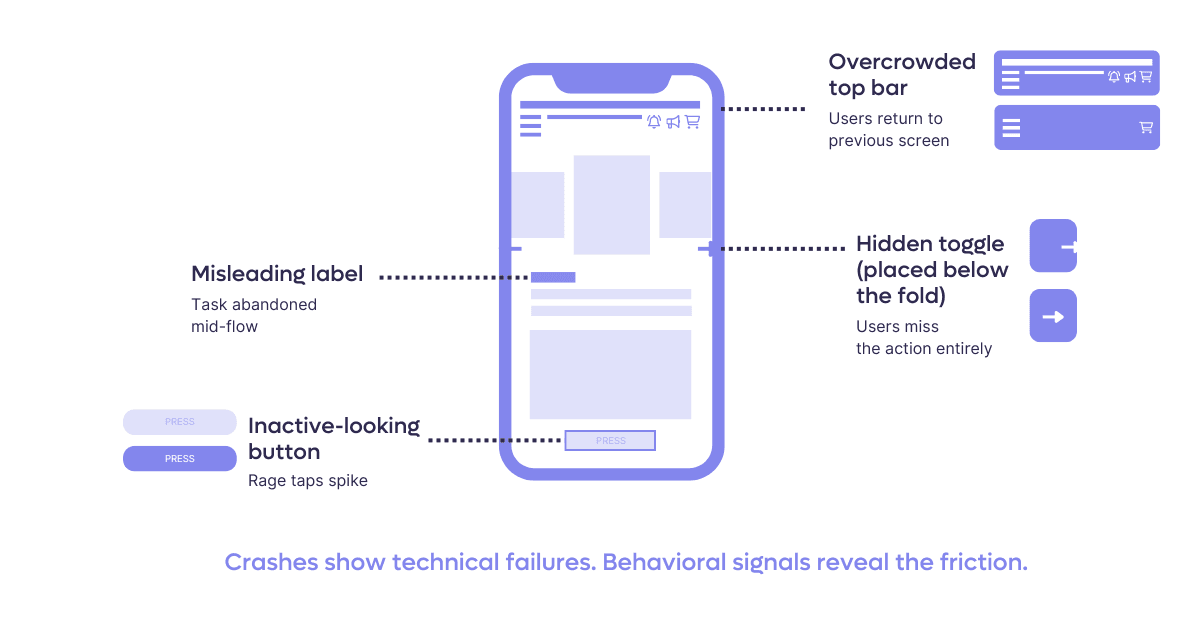
These tiny points of friction push users away quietly, long before the numbers reveal a problem.
As CUX Digital Expert Analyst, Daria Ushanova, puts it: A user who installs your mobile app isn’t just visiting - they’re choosing a long-term relationship with your brand. That’s why an app shouldn’t be a copy of a website, but a product shaped around how mobile users actually behave.
CUX approaches the problem differently. Instead of relying only on event tracking, it uses a lightweight native SDK for iOS and Android applications that captures interaction data directly from the app interface. Because the SDK interprets native UI components rather than web structures, visit recordings and heatmaps reflect exactly what the user experienced on the device.
Why traditional mobile analytics tools miss behavioral friction
Many organizations rely on several mobile analytics tools to monitor installs, sessions, crash reports, and conversion funnels. While these tools provide useful mobile data analytics, they rarely show how users actually interact with the interface. Without behavioral visibility, teams see metrics change but struggle to understand what caused the shift.
Quick Reality Check: Signs of silent churn In practice, teams rarely experience this as a sudden technical failure. More often, the warning signs look like this:
- Feature adoption is visibly lower than expected after release
- Retention drops after updates, but crash reports show no anomalies
- Support tickets describe vague confusion rather than clear errors
- Product, UX, and Analytics teams interpret the same rollout results differently
When these patterns repeat after consecutive deployments, the issue is rarely “market noise.” It usually indicates that behavioral friction is accumulating outside the scope of standard app metrics.
The mobile industry is currently over-investing in acquisition while dangerously under-investing in post-install behavior. Teams continue to trust sterile dashboards over actual user experience evidence, even when the data can’t explain why users are dropping off. You don't need a PhD in data science to understand a visit recording or a heat map. In a market where loyalty is fragile, seeing what your users actually experience is no longer a luxury - it’s a survival requirement.
Paulina Walkowiak, CEO CUX
The “wait and see” problem in mobile app analytics
For large organizations, the cost of fixing an error on production is not linear; it is exponential.
When you rely on a “launch and wait” model - releasing features and waiting for quarterly sales results to judge success - you are exposing yourself to massive risk. By the time you see a "drop" in your app performance in the quarterly spreadsheet (a lagging indicator), the damage is done.
The risks of the "Old Process" include:
- Scale of impact: In enterprise apps, a bad rollout impacts millions of users instantly.
- Support overload: A confusing feature lowers conversion, floods your call center with frustrated customers, and increases your app CAC (Customer Acquisition Cost).
- Reputation damage: In sectors like banking, a usability flaw isn't seen as a "bug", but as a breach of trust.
- Operational drag: Emergency fixes require pulling multiple teams off their current sprints to fight fires.
Example: Imagine you deploy a new "Dark Mode" feature for your banking app. Standard mobile analytics show the app is stable (no crashes). However, behavioral analysis reveals that on iOS devices, the "Confirm Transfer" toggle is invisible in Dark Mode due to a color contrast bug.
Without behavioral data, you see a drop in transfers and assume it's a market fluctuation. With mobile app analytics from CUX, you see on heatmaps users repeatedly tapping an empty space and then closing the app. You identify the UI bug in minutes, not weeks.
Why mobile punishes bad UX harder than web
Magdalena Barwińska
Digital Experience Analyst in CUXWeb users have workarounds. Mobile users don't. Understanding what makes app UX fundamentally different from web is the first step to catching the problems your metrics won't flag.
01
The "No safety net" reality
On the web, users often treat desktop as a backup if a mobile site fails them. In a native app, there is no "escape hatch." If a process is poorly designed or buggy, the user journey ends right there, often permanently. In mobile analytics, mobile-first isn't just a design principle; it’s the only way to ensure conversion, as users won't switch devices to fix your app’s friction.
02
Navigation: Depth is the enemy
App navigation requires much more discipline than web structures. Deep nesting often leads to "navigation fatigue," where returning to the initial stage feels like a chore. Monitor "back-click" loops and drop-off rates on deep screens - if a user has to tap "back" five times to change one parameter, your flow is a barrier, not an enabler.
03
Ecosystem consistency over mirroring
To the customer, your brand is a single entity, regardless of the platform. Drastic shifts in logic between web and app create cognitive dissonance and erode trust. Don’t aim for a 1:1 copy, but identify key behavioral patterns from the web and evolve them for the app. Users expect a seamless transition - they want the same reliability they know from the web, but with a superior, app-optimized experience.
This is why the same feature can perform on web and fail on mobile. A focused CUX review of your post-release visits will show you where these patterns are hitting your users hardest.
The shift: using behavioral mobile analytics to experiment safely
The solution is a shift in methodology. We need to move from "Big Bang" redesigns to a Culture of Experimentation.
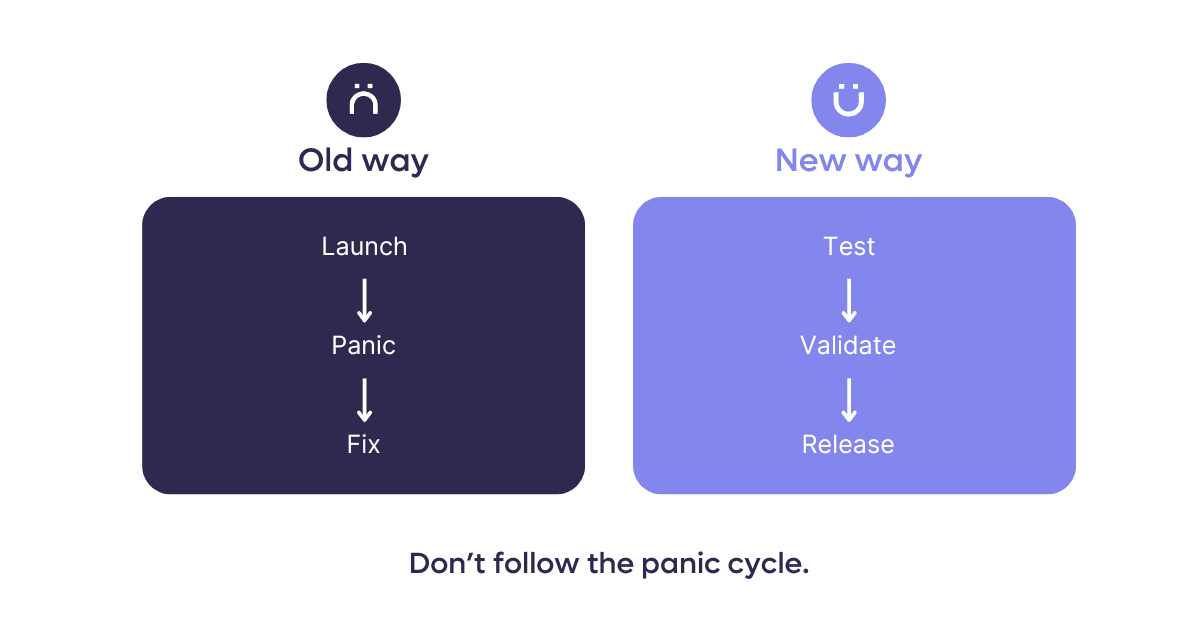
This approach treats the application as a living organism. Instead of changing everything at once and hoping for the best, mature organizations implement A/B tests and incremental changes, measuring the impact of each move in real-time.
Real-world proof: Using app engagement metrics to fix user anxiety
Theory is one thing, but how does this look in practice? LPP , a global retail giant, provides the perfect example of moving from "data overload" to clear, actionable insights.
Despite having sophisticated dashboards for their flagship brand, Sinsay, and a massive amount of data across 186 unique app views, LPP struggled to understand the "why" behind user behavior. They needed to move from raw reporting to strategy.
**The hidden friction: **By implementing behavioral analytics (CUX), they uncovered a critical insight that standard charts missed regarding Post-Purchase Anxiety.
Data revealed that 1 in 3 users who completed a purchase immediately returned to the order confirmation screen. Traditional analytics: Would likely count this as "high engagement" or page views.
Behavioral analytics revealed the truth - users were anxious. They were looking for reassurance that the transaction was successful because the confirmation wasn't clear enough.
The result: Instead of a costly redesign or waiting for support tickets to pile up, the team implemented a "Quick Win": clearer progress indicators and visual confirmation cues. They fixed the friction point immediately, improving the experience without a massive overhaul.
How teams spot deployment failures before revenue drops
What makes this approach different is timing. Instead of diagnosing problems weeks after a release, teams observe how users react at the exact moment a change goes live. That shift from delayed interpretation to immediate behavioral feedback is what turns analytics from a reporting tool into a practical risk-control layer.
If the app crashes, Visit recordings in CUX can also reveal what the user was doing moments before the application closed.
Here is how the "Quick Win" workflow protects the enterprise:
- Immediate visibility: You launch small design changes instead of comprehensive redesign overhaul.
- Behavioral validation: You don't wait for sales data. You look at the behavioral recordings immediately.
- The reality check: Recordings and heatmaps show users repeatedly tapping the new “Apply” button because they think it’s inactive.
- The pre-emptive fix: You correct the UI before the rollout hits 100% of your user base.
Conclusion: Mobile analytics is your deployment insurance
Behavior analytics allows you to verify if a function works for the human user, before you are forced to frantically repair it.
By catching errors in the micro-interactions early, you stop the "panic loop" before it starts. It’s your insurance policy for successful deployments. It gives you confidence that when you do look at those quarterly results, you see growth, not a recovery plan.
You don’t need to audit your entire app to reduce deployment risk. In most cases, reviewing one high-impact flow is enough to reveal whether users hesitate, misclick, or get stuck.
→ Check one critical flow with behavioral validation. Contact our expert.
FAQs
What is mobile analytics?
Mobile analytics refers to the tools and methods used to understand how users interact with a mobile application. It includes metrics such as engagement, retention, feature adoption, and user behavior inside app flows. By analyzing this data, product teams can identify friction points and improve the overall user experience.
Why aren’t crash reports enough to understand mobile app problems?
Crash reports show when an application fails technically, but they rarely explain what the user experienced before the failure. Behavioral mobile analytics adds context by showing how users interact with the interface - for example which screens they navigate through, where they hesitate, or where they abandon a process. This makes it easier to diagnose usability issues that traditional monitoring tools miss.
How does CUX Mobile analyze behavior inside native apps?
CUX Mobile works through a lightweight SDK integrated into iOS and Android applications. The SDK captures interactions such as taps, gestures, and navigation between screens, allowing teams to review visit recordings and gesture heatmaps that reflect the real experience inside the app interface.
Can CUX connect mobile app behavior with website behavior?
Yes. When a user logs in across both the website and the mobile app, CUX can connect those visits using a shared identifier. This allows teams to analyze a single customer journey across devices instead of viewing mobile and web visits separately.
Does mobile analytics affect mobile app performance?
Modern mobile analytics platforms are designed to run efficiently inside applications. The CUX Mobile SDK operates in the background and sends data in optimized batches, minimizing impact on performance, battery usage, and network traffic.