April 22, 2026
14 min read
The 'silent treatment': What it means when users visit your key pages but take no action
Your website attracts traffic and users reach key pages - pricing, product, checkout - but they don't convert. Standard analytics can't explain why. Tools that track behavioral data reveal the exact moments of hesitation, confusion, and friction that stop visitors from taking action.

Agata Olbrycht
Content Strategist @ CUX

Users reach your key pages and leave without action. The cause is usually experience friction: confusion, mistrust, glitches, mismatched expectations, or decision paralysis. Standard dashboards show bounce rates and exits, but they don’t explain the cause. Behavioral analytics with CUX connects the two. Visit recordings show where users hesitate, heatmaps show what gets attention, and experience metrics like rage clicks and chaotic scrolling point to elements that block progress. The fix starts with seeing what users see.
TL;DR
- Traffic means nothing if users go quiet on your key pages. According to PwC, 32% of customers will leave a brand they loved after just one bad experience, and most never tell you why.
- Standard metrics show what happened, not why. To increase conversion rate, you need to see what users actually experienced.
- Behavioral analytics shows how people interact with your site: clicks, scrolls, pauses, hesitation.
- User flow and journey mapping reveals where they drop off or get stuck.
- Experience metrics (like rage clicks or chaotic movement) expose frustration and confusion - the invisible barriers that conversion rate optimization is designed to remove.
- Silence usually comes from five causes: confusion, mistrust, bugs, mismatched expectations, or decision paralysis.
- Fix it by improving CTAs, simplifying actions, building trust, solving mobile friction, and offering clear next steps.
You’ve done everything right. Website traffic is up. Users are landing on your key pages - pricing, product, checkout, signup, and then… silence. They browse, but don’t click the button, fill out the form, or complete a purchase. For marketers, designers, and business owners, this silence is just frustrating, but also expensive. It’s natural to ask: what’s the cause? And more importantly: how do you increase conversion rate when the traffic is there but the action isn't?
Why users visit but don't convert: Going beyond basic website metrics
The answer isn’t just in what users do, but in understanding why they do it. To get there, you need to look beyond surface metrics and analyze their full on-site behavior: every click, scroll, and moment of hesitation. That’s where real answers hide.
This is the essence of behavioral analytics and customer journey mapping. These methods turn engagement from guesswork into clarity and help you see exactly where people struggle, lose interest, or give up. With this insight, improving your website stops being a shot in the dark and becomes a matter of informed decisions.
Most website analytics platforms are good at telling you what happened. Standard conversion rates analytics will show you how many people visited your site (page views), how long they stayed (session duration), and how many left without interacting (bounce rate or exit rate). These are helpful for identifying that something isn't working, but rarely enough to explain why.
Think of these numbers as symptoms. They show you that you have a problem, but they won’t diagnose the cause. A high exit rate on your pricing page, for example, tells you people are leaving, but not why they’re walking away.
To get to the root of these issues, you need to focus on user experience roadblocks: the moments of friction, doubt, or frustration that stop people from moving forward. Often, inaction comes down to one of these five reasons:
1. Confusion & friction
The visitor is ready to act, but the path forward isn’t clear. A call-to-action might be hard to find, form fields could be confusing, or navigation simply feels clunky and unintuitive.
➡ Where it shows up: Pricing pages with too many options, checkout pages with unclear steps, or product pages with overwhelming detail.
2. Lack of trust & credibility
People are naturally cautious online. Missing trust signals like customer reviews, testimonials, clear contact information, or security badges will make them hesitate to share their data or make a purchase.
➡ Where it shows up: Signup forms asking for too much data too soon, checkout pages lacking payment security reassurance, or pricing pages without guarantees or clear refund policies.
3. Technical glitches & bugs
Sometimes the problem is purely technical. A button won’t work, a page won’t load on mobile, or a link leads to a 404 error. This is where behaviors like rage clicks appear (when users frantically click something that doesn’t respond).
➡ Where it shows up: Checkout flows, mobile signups, key CTAs on product pages.
Practical Tip: A broken "Add to Cart" button on mobile is a classic example. Your analytics might show the user exited, but not that a bug was the real reason you lost a sale.
4. Mismatched expectations
The user clicked an ad, a social media post, or a link expecting one thing, but landed on a page delivering something else. This disconnect between promise and reality leads to fast exits.
➡ Where it shows up: Pricing pages that hide costs, product pages that oversell features not clearly delivered, or signup flows that suddenly ask for more than expected.
5. Decision paralysis
Too many choices, too much information. A wall of text or dozens of similar product options can overwhelm users. When that happens, the easiest decision is often to leave.
➡ Where it shows up: Pricing pages with excessive tiers, product pages packed with specs but no clear benefits, or checkout pages with too many optional add-ons.
This is why pricing page optimization is such a critical part of ecommerce conversion rate optimization - every unnecessary element on a pricing page adds cognitive load that pushes users toward the easiest decision: leaving.
The "How": Seeing your website through your users' eyes
When users hesitate, it’s usually due to friction, doubt, or confusion. The challenge is knowing where those moments occur, and why.
Instead of focusing on individual pages or isolated numbers, it helps to look at the entire path a person takes across your site. A user journey map shows where people start, how they move between pages, and where their experience begins to break down.
Take a simple case: someone lands on your pricing page after reading about your product. They scroll up and down, pause, maybe switch tabs, and eventually leave. Standard analytics will tell you they exited the page. but a user journey map will help you understand the hesitation that led to that decision.
To spot this kind of behavior, you need tools that capture both the full journey and the small signals that reveal uncertainty.
CUX helps you do that by showing how people interact with your site through heatmaps and Visit Recordings.
- Heatmaps give a clear visual summary of where users click, scroll, or pause. You can quickly identify which areas draw attention and which are ignored.
- Visit Recordings let you see real user sessions, including clicks, scrolls, taps, pauses, and tab switches across multiple tabs. You’re able to watch hesitation unfold and trace the exact sequence that led to it.
And here’s where CUX truly stands out: you don’t have to sift through endless recordings or heatmaps. Instead, the platform provides pre-filtered insights tied directly to your business goals. It points directly to the behaviors that block conversions or slow down decision-making, so you can focus on areas that need improvement.
With these insights, you build a clear picture of what is helping users and what is holding them back. You can focus on improving the experience with confidence.
Experience metrics: What user frustration looks like in conversion rates analytics
Once you know where users hesitate, the next step is figuring out what’s behind that hesitation. That’s what Experience Metrics help you do. These behavioral signals, tracked by CUX, identify friction points that standard analytics can’t detect.
Here are the most important Experience Metrics to observe:
Bounce Back
→ A user lands on a page and leaves without scrolling or clicking. This often means the content didn’t match their expectations or wasn’t engaging enough to explore.
Examples: Clicking a paid ad that leads to a generic homepage; opening a mobile page where the content doesn't load above the fold.
Rage Clicks
→ Rapid, repeated clicks on the same spot, usually out of frustration. This signals that the element looked interactive but didn’t respond.
Examples: A “Buy Now” button that’s broken; clicking a dropdown that doesn’t open; icons styled like buttons with no action.
Rage Key Press
→ Fast, repeated key presses in a short span. This often signals frustration, not just with typing, but also when trying to trigger an action via keyboard that doesn’t respond.
Examples: Repeatedly hitting Enter to submit a form that doesn’t react; pressing Tab or arrows to navigate a form and nothing moves; typing into a field that clears itself on each attempt.
Dead Clicks
→ Clicking on something that doesn’t do anything because it’s not actually clickable. This usually means the user mistook a design element for an interactive one.
Examples: Clicking on a product spec title that looks like a tab; tapping on underlined text that isn’t linked.
Chaotic Scrolling
→ Scrolling quickly up and down several times within seconds. The user is likely trying to locate something they expected to see but can’t find.
Examples: Searching for key pricing info hidden deep in a block of text; looking for a CTA that’s placed too low on the page.
Chaotic Cursor Movement
→ Erratic or repetitive pointer movement, loops, or zig-zags. Suggests the user is confused or overwhelmed, possibly unsure what’s clickable or where to go next.
Examples: Scanning a cluttered pricing table; hovering over multiple sections without clicking; moving the cursor in circles on a form page.
Refreshing
→ The user reloads the page manually during the session. This usually means an element isn’t loading, or a key interaction (like a form submission) failed.
Examples: Payment screen freezing after entering details; reloading a signup form that returns a blank page.
Zooming
→ Manual zoom in or out, typically on mobile. Indicates that something is hard to read or trust visually.
Examples: Pinching to zoom in on blurry product photos; enlarging small text on a form; zooming to check unclear button labels.
Each of these Experience Metrics tells a story about where the user journey breaks down. In CUX, you can filter heatmaps and recordings by specific Experience Metrics, so you don’t have to guess where frustration happens, you can see it immediately.
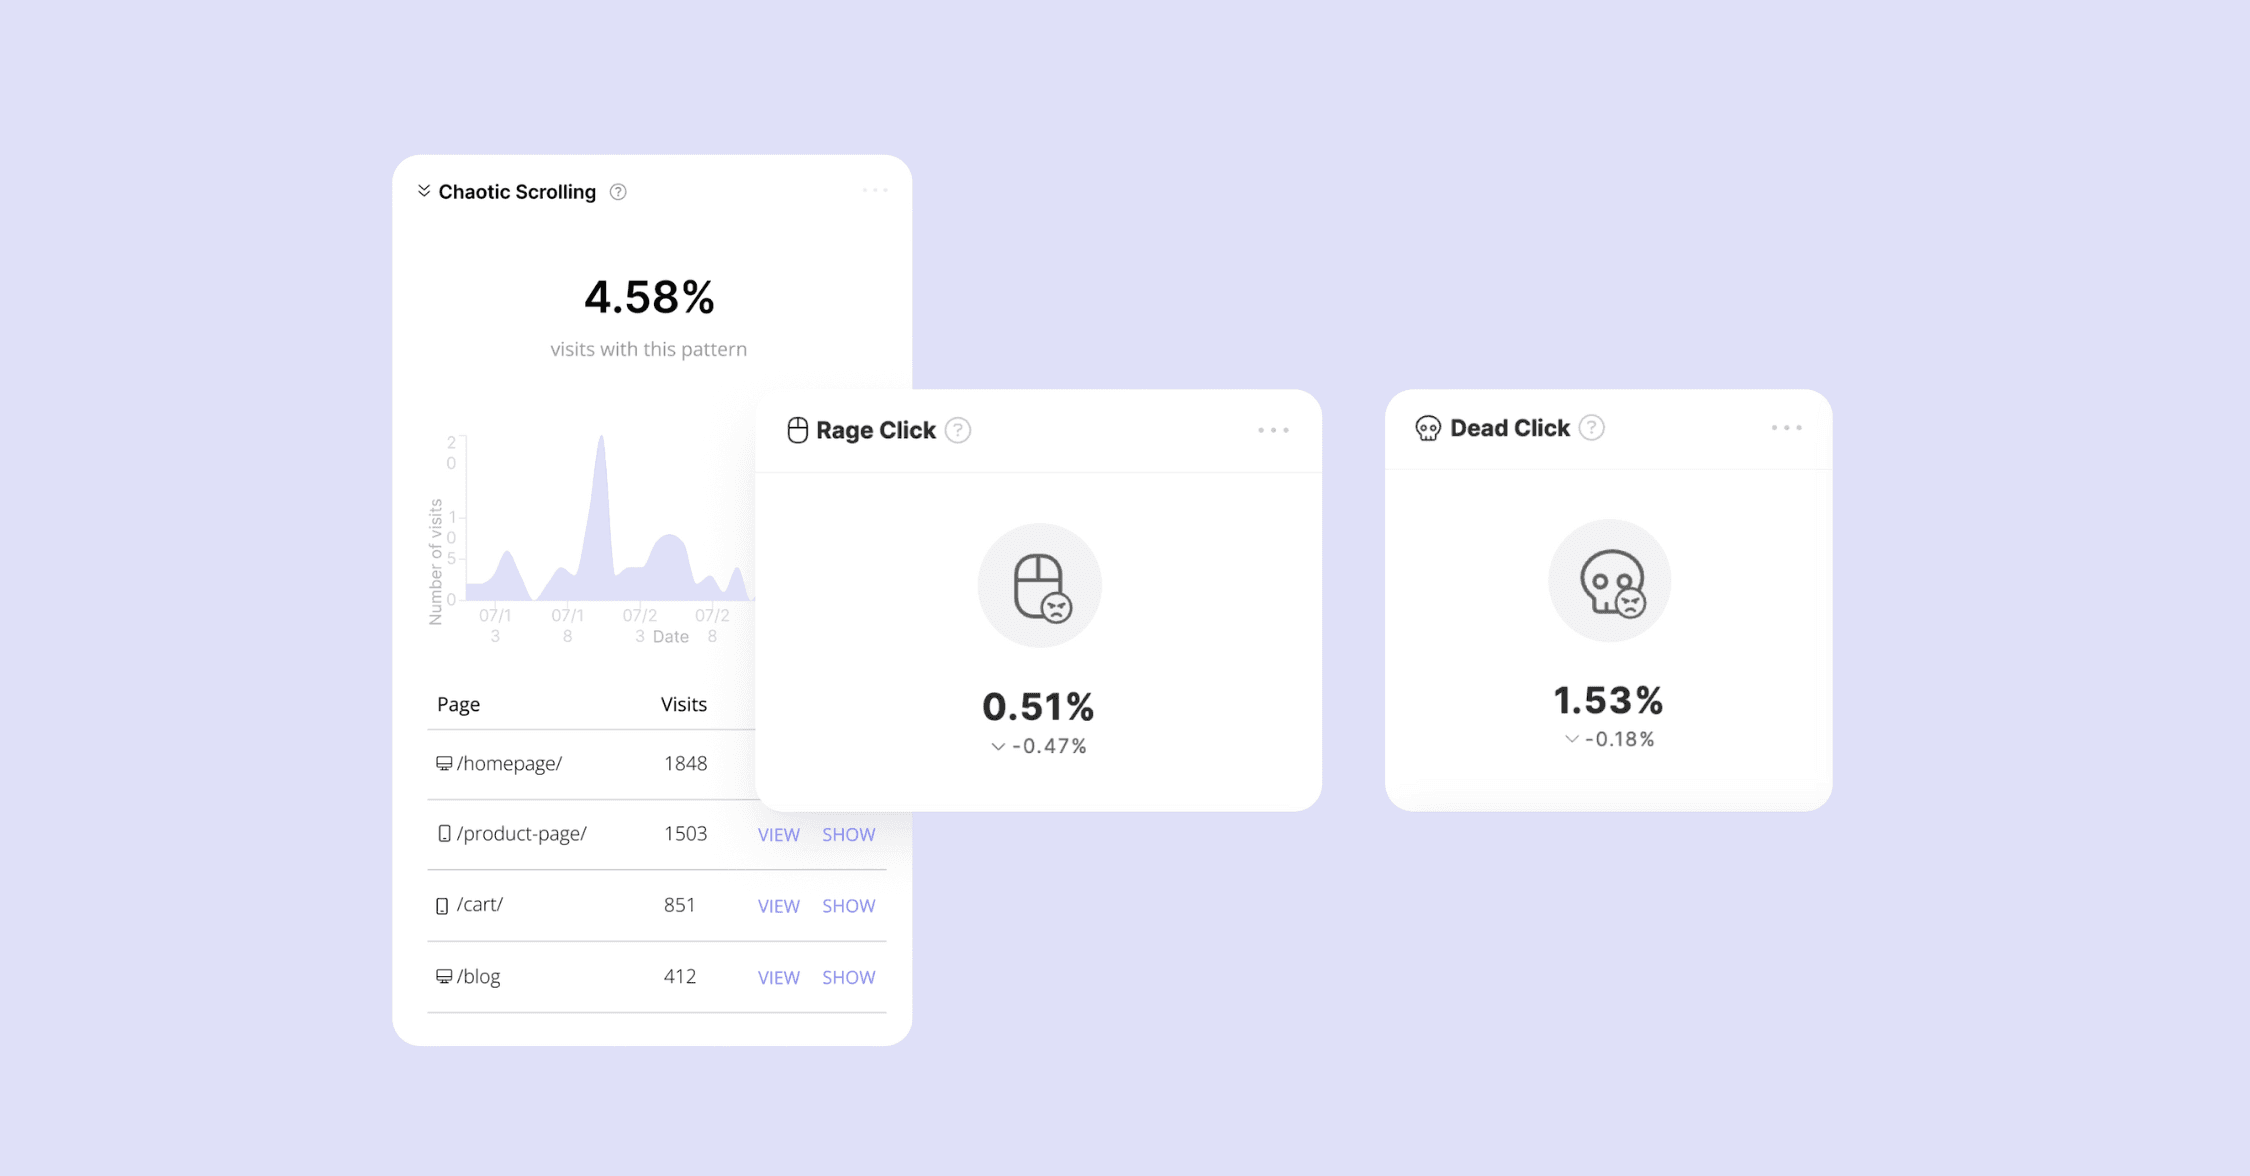
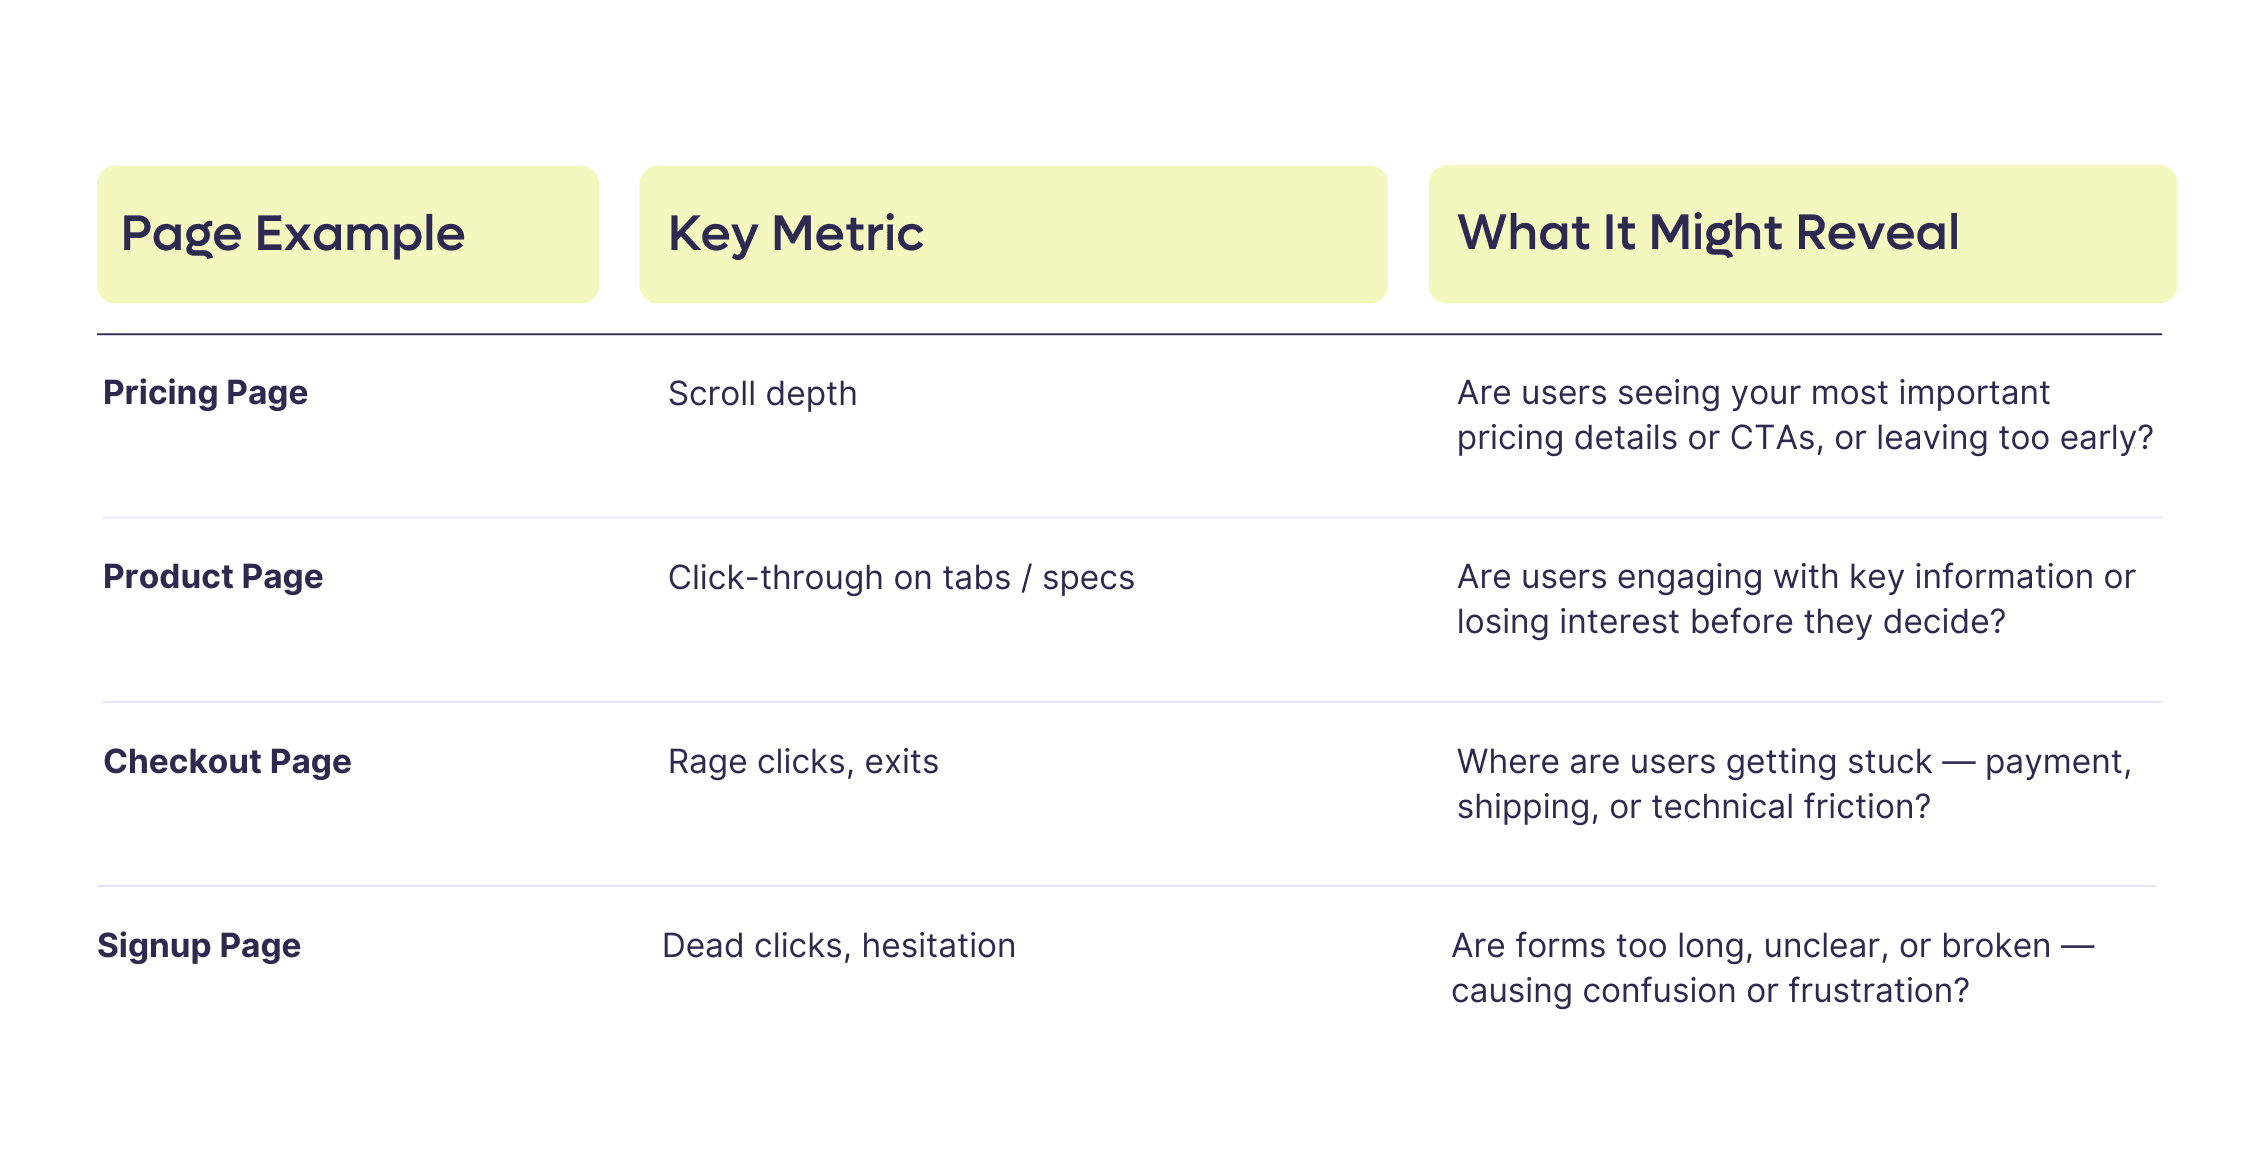
Below are examples of metrics that often help diagnose why users fall silent on important pages like pricing, product, checkout, or signup.
The Fixes: How to increase conversion rate on pages where users go silent
Once you’ve spotted where users hesitate or drop off, the next step is to understand what’s behind it, and start fixing the problem. Metrics and behavioral signals help you see where the friction is, but the real progress comes from applying those insights to improve the experience.
Here are five conversion rate optimization best practices that address the most common reasons users visit key pages but don't act.
1. Refine your Calls-to-Action for the context of the page
A vague or generic CTA is one of the most common reasons users hesitate. On key pages like pricing or product details, make sure your CTA reflects the user's mindset at that exact moment. Instead of “Learn More,” try “See Detailed Pricing” or “Check Delivery Options” - something that directly answers the question they might still have at this stage.
If your metrics show people hovering but not clicking, revisit both your wording and placement. Is it clear what happens next when they click?
2. Simplify the path to action
If you’re seeing hesitation on pages like signup or checkout, the cause is often unnecessary complexity. Use your data to remove distractions:
- Eliminate optional fields from forms where possible.
- Collapse secondary content or FAQs behind accordions to keep the focus on action.
- Break long processes (like signups) into smaller, clearer steps if scroll depth shows users giving up halfway through.
Look for areas where your design may be slowing people down, and simplify relentlessly.
3. Rebuild trust where silence signals doubt
Silent exits from pricing, contact, or sign-up pages often point to a trust gap. Behavioral metrics like hesitation or repeated cursor movements are clues that users are looking for reassurance. Strengthen these pages by:
- Adding microcopy next to fields that explain how data will be used.
- Reinforcing social proof close to the CTA (client logos, testimonials, reviews).
- Highlighting guarantees or return policies in checkout flows.
Trust isn’t just visual, it’s about removing the small doubts that stop people from acting.
4. Prioritize fixing what frustrates mobile users
If your frustration signals (rage clicks, chaotic movement) spike on mobile, this isn’t just a tech problem, it’s costing you conversions. Use mobile-specific tools to identify pinch points like:
- Elements too close together to tap easily.
- Buttons disappearing under overlays.
- Forms that break or autocorrect fields aggressively.
Fixing mobile frustrations often unlocks the quickest wins.
5. Reframe stagnant pages with a clear next step
If scroll depth shows users are reaching the bottom of a key page but not acting, the page likely lacks closure. End pages with a clear next step, not just another block of information. Think:
- “Still have questions? Book a quick demo.”
- “Not sure? See how others solved this problem.”
- “Ready to start? Get a custom quote today.”
Silence often comes from uncertainty. Don’t assume people know what to do next - guide them.
What next? Let's make your pages speak up
Breaking the silence starts with understanding where users hesitate, but change comes from knowing how to optimize for conversions based on what you've found. If you want expert eyes on where your key pages are going quiet, and what to do about it, get in touch.
We’ll help you turn your silent visits into engaged users and measurable results.
FAQs
Q: Why do users visit key pages but not convert?
A: Users who visit pricing, product, or checkout pages without taking action are usually experiencing one of five barriers: confusion (the path forward isn't clear), lack of trust (no reviews, guarantees, or security signals), technical glitches (broken buttons, failed loads), mismatched expectations (the page doesn't deliver what the ad promised), or decision paralysis (too many options, too much information). According to PwC research, 32% of customers leave a brand after just one bad experience. Standard analytics shows the exit, and behavioral analytics shows which of these five barriers caused it.
Q: How does behavioral analytics help increase conversion rate on underperforming pages?
A: Traditional analytics tells you that 40% of users left your pricing page. Behavioral analytics shows they scrolled up and down the pricing table 3 times, hovered over 2 tier names without clicking, and left after 22 seconds, suggesting they couldn't tell the difference between the options. That behavioral context turns "people are leaving" into a specific, fixable diagnosis. Digital experience analytics tools like CUX capture visit recordings, heatmaps, and experience metrics (rage clicks, dead clicks, chaotic scrolling) that reveal the exact moment users lose confidence or clarity.
Q: What are experience metrics in CUX and how do they relate to conversion rate optimization?
A: Experience metrics in CUX are behavioral signals that indicate user frustration, confusion, or hesitation. They include rage clicks (rapid repeated clicking on an unresponsive element), dead clicks (clicking something that isn't interactive), chaotic scrolling (rapid up-and-down movement), zooming (pinching on mobile), and page refreshing. Unlike standard metrics like bounce rate or session duration, experience metrics show how users interacted with specific elements on the page. In conversion rate optimization, experience metrics are the diagnostic layer that tells you why a page underperforms, so you know what to fix instead of guessing.
Q: What is the difference between a bounce and a "silent visit"?
A: A bounce happens when a user lands on a page and leaves immediately without any interaction. A silent visit is different - the user stays, scrolls, maybe even clicks a few things, but never completes the desired action (purchase, sign-up, form submission). Silent visits are harder to detect and often more costly than bounces because the user clearly had some interest. Behavioral analytics reveals what happened during these visits: hesitation patterns, frustration signals, and the specific elements that blocked progress. Fixing silent visits is often the fastest path to increasing conversion rate because you're converting users who already demonstrated intent.