October 27, 2025
4 min read
Boost engagement: 4 key factors driving user behavior on your website
How to attract traffic to your website?! If you’re working with user experiences, you’ve probably asked yourself this question many times.

Kamila Kotowska
Head of Growth at cux.io

Updated October 2025
Customers primarily notice simple navigation (user flow), clear payment methods, credible social proof, and a user-friendly design; optimizing these elements based on user behavior analysis is key to reducing user frustration and improving website effectiveness.
.........
There is no definitive answer to the question of what attracts a user the most while using a website. However, our experience in researching and analysing observable pages shows that there are certain features that certain features significantly impact customer sentiment more than others.
4 things that make up attractive pages for your customers
Simple website navigation to attract more traffic
Simple and intuitive page navigation is one of the basics that makes your pages more attractive! It is also one of the easiest mistakes to spot when analyzing user behavior. Any customer confusion disrupting the intended user flow will be immediately visible in Conversion Waterfall traffic drops.
Practical Example: Fixing Navigation Friction
Problem Identified: Using user behavior analysis tools (like CUX), you notice on visit recordings and heatmaps that many users visiting a specific product category page exhibit chaotic mouse movements. They also frequently click back to the main menu or use the site search immediately after landing on the category page. Your Conversion Waterfall shows a significant drop-off at this stage. This suggests the navigation within or to this category is confusing (user frustration related to user flow).
Optimization Action: You simplify the sub-category filters on that page, making them clearer and more prominent. You also add clear breadcrumb navigation (e.g., Home > Category > Sub-Category) near the top so users always know where they are and can easily go back one level.
Likely Outcome: After implementing the changes, you monitor the same category page. New visit recordings show less chaotic movement, heatmaps indicate users are interacting with the improved filters, and the Conversion Waterfall shows a reduced drop-off rate. Users are finding products more easily, leading to a potential increase in conversion rate.
Transparent payment processes build trust
As cliché as it sounds, it is one of the most important things consumers look for on websites! Clearly described, marked, and standardized information on payment methods is crucial if you want to increase conversion rate. Inconsistencies, as a rule, are associated with a decrease in customer confidence. In effect, they stop perceiving your page as an attractive website and start to feel suspicious about your business.
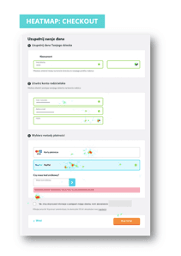
Problem identified with CUX: Users got lost while choosing subscription type, they would go back and try to change their initial choice. As a result, they’ve dropped out of the purchase path and never came back to the checkout / screen: cux.io
Users look for social proof on websites
As much as 70% of users will trust a recommendation from someone they don’t even know. The average consumer reads even up to 10 online reviews before considering a purchase (Social Proof Statistics / Optinmonsters.com). The elements that make the brand credible are therefore one of the most important features that users look for on the website.
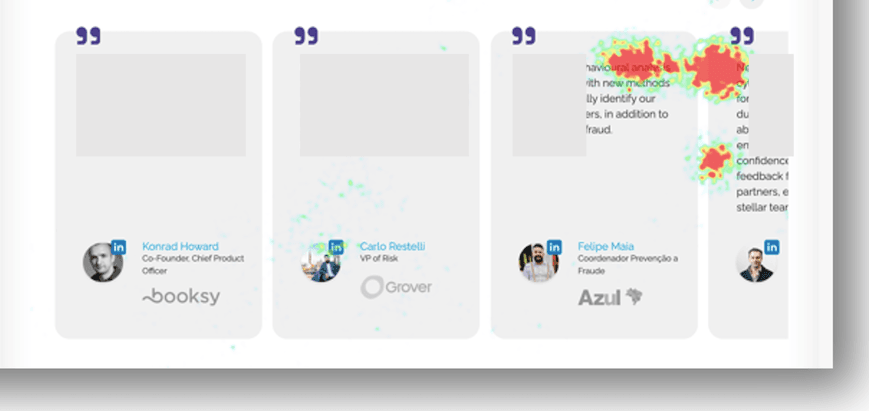
Heatmaps can show you how users interact with your social proof display and help you optimize it to their needs / screen: cux.io
User-friendly design is the key to retaining traffic
Photos, graphics, videos – this is a very broad subject when we talk about how to attract people’s attention on a website. Apparel e-commerce will have different design guidelines than companies selling services in the B2B model. What is essential is optimizing the overall user interface and your clients’ experiences when they encounter graphics. You can track their emotions easily with Experience Metrics, in particular—zooming and page refreshing.
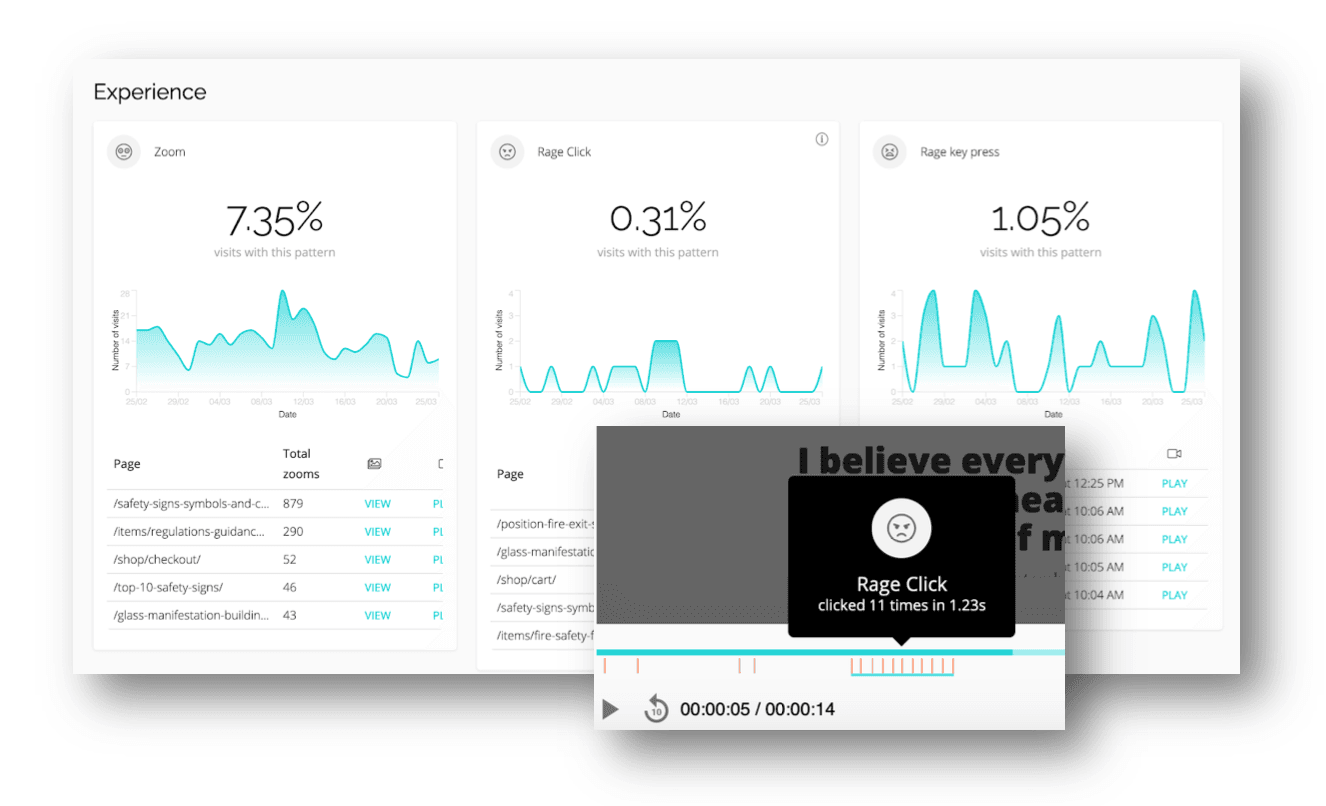
Users zoom their view to get a closer look at page elements that appear too small or unreadable on mobile devices. Users refresh pages if some page elements haven’t loaded correctly, they hope to see the misplaced or misaligned parts of the page or the page loads too slowly / Experience Metrics, cux.io
Ultimately, understanding what captures customer attention - clear navigation, trustworthy payment processes, social proof, and intuitive design - isn't about guesswork. It's about observing real user behavior. By focusing on these four key areas and using behavioral analytics to see exactly where users engage or struggle, you can move beyond assumptions and make data-driven improvements that truly enhance the user experience and drive results.
Ready to see exactly what your customers are paying attention to?
CUX shows you the real interactions, highlights friction points, and helps you optimize the user flow based on actual behavior.
Talk to our experts to discover your website's biggest opportunities.