April 29, 2026
13 min read
Small dataset, big insights: how we do B2B marketing research without mass traffic
Aleksandra Romańczyk (Valueships) shows how B2B teams with limited traffic can still run effective research without waiting for scale. This piece breaks down how she turns small datasets into real insight using behavioral signals, form data, and direct client conversations.

Aleksandra Romańczyk
Head of Growth @ Valueships

There's a certain kind of pressure that comes with being a B2B marketer in a niche space. You open your analytics dashboard, and the numbers stare back at you — a few hundred sessions a week, a modest email list, a form that gets maybe 15 submissions a month. You've read all the growth playbooks. They all assume you have enough data to run statistically significant A/B tests, build conversion funnels with thousands of entries, and segment your audience into clean cohorts.
You don't. And honestly? Most B2B companies don't either.
Here's what I've learned running growth at Valueships — a pricing consultancy operating across European markets. When your dataset is small, the answer isn't to wait until it gets bigger. The answer is to change what you're measuring — and how.
TL;DR
- Most B2B marketing playbooks assume you have scale. Most B2B companies don't — and that's fine.
- When your dataset is small, qualitative and behavioral research isn't a consolation prize. It's the right tool for the job.
- Heatmaps on low-traffic pages reveal directional patterns you can act on immediately — even without statistical significance. (Our DACH vs. Benelux findings came from exactly this.)
- Form submissions are behavioral data. The language people use to describe their problem tells you how to write your messaging.
- Calling converted clients for 15-20 minutes beats six thousand anonymous session recordings for actionable insight.
- The goal isn't a bigger dataset. It's asking better questions with the data you already have.
The myth of the big dataset
A lot of marketing advice is written for companies with scale. Thousands of monthly visitors, tens of thousands of leads, product analytics tracking millions of micro-events. In that world, behavioral data is easy — you just look at the aggregate and patterns emerge.
But most B2B companies, especially those selling to specific verticals or niche industries, don't operate at that scale. At Valueships, our total addressable market is deliberately focused — pricing consulting for SaaS and tech companies across Europe. We're not going to get 50,000 monthly sessions. We get a few hundred qualified people who actually belong there — and each one of them matters enormously.
This is where the conventional approach to data breaks down. You can't run meaningful A/B tests on a pricing page that sees 200 visits a month. You can't build statistically robust conversion funnels when your form gets 12 submissions in a good week. The tools exist, the methodology exists — but the data volume simply doesn't support the conclusions.
So what do you do instead?
Qualitative data isn't a consolation prize
There's a tendency in modern marketing to treat qualitative research as the fallback — what you do when you don't have enough quantitative data to be "rigorous." That framing is completely backwards.
Qualitative data doesn't just tell you what is happening. It tells you why. And in B2B marketing, where buying decisions are complex, involve multiple stakeholders, and stretch over weeks or months, the "why" is almost always more valuable than the "what."
A quantitative funnel can tell you that 68% of people who land on your pricing page leave without clicking anything. Qualitative research tells you they left because they couldn't figure out which plan was meant for a team their size — or because the pricing felt disconnected from the problem they were actually trying to solve. One insight leads to a minor layout tweak. The other leads to a complete rethinking of how you communicate value.
At Valueships, we've built our entire understanding of value communication around exactly this gap. Our WTP waterfall framework — which maps the journey from actual value generated, through perceived value, to willingness to pay, to final price — exists precisely because the distance between what a product is worth and what a customer believes it's worth is rarely captured in a conversion rate. You need qualitative signals to understand where that gap lives and why.
When you're working with a small dataset, every conversation, every form response, every heatmap session becomes a signal rather than a data point. The goal shifts from statistical significance to pattern recognition — and pattern recognition is something humans are actually very good at, even with small samples.
Behavioral analytics: what it actually looks like with limited traffic
Behavioral analytics sounds intimidating when you imagine enterprise-scale session recording tools processing millions of events. In practice, for a B2B company with modest traffic, it looks much more human.
Take heatmaps. At Valueships, we run them on our own site — and the most instructive example came from our pricing report campaigns. We were promoting downloadable reports across different European markets and set up heatmaps on the landing pages — not expecting clean statistical patterns, but wanting to understand what people were actually paying attention to.
What we found was genuinely surprising and immediately useful.
Users from the DACH region scrolled directly to the section about the authors and experts behind the report. They wanted to know who wrote it before they decided whether to download it. Credibility through authority — classic DACH buying behavior. The report's content mattered less than the people behind it.
Users from Benelux and the Nordics behaved completely differently. They spent their time on screenshots from inside the report, on the sneak peek sections, on visual previews of what they'd actually get. Show me, don't tell me. The experts were irrelevant until they'd already decided the content looked worth their time.
Same page. Same report. Same call to action. Completely different behavioral patterns.
Were these findings statistically significant? No. Were they directionally clear and immediately actionable? Absolutely. We restructured the pages by market — leading with expert credentials in DACH, leading with content previews in Benelux and Nordics — and saw meaningful improvement in download rates. Two pages, one insight, zero additional budget.
This is behavioral analytics at the scale most B2B marketers actually work with. Not big data. Pattern data.
Form analysis: the underrated goldmine
One of the most consistently underused sources of behavioral intelligence in B2B marketing is the contact form. Most companies treat submissions as leads to be passed to sales. But if you read them as behavioral data — as a collection of signals about how people describe their own problems — they become something much more valuable.
When someone fills out a form to inquire about a pricing project, the language they use matters enormously. Do they frame their problem in terms of revenue ("we're leaving money on the table"), process ("our pricing is a mess internally"), or outcomes ("we want to raise prices without losing customers")? Are they specific or vague? Do they mention urgency, or are they in early exploration mode?
At Valueships, reading form submissions carefully over time has given us one of the clearest pictures of where our clients actually are in their buying journey when they first reach out — and what they believe their problem is, which is often different from what their actual problem turns out to be. That gap is itself a marketing insight. If most people describe their problem as "we don't know how to price our new product" rather than "we need a pricing consultant," your content should lead with their language, not yours.
This is case-by-case analysis, and it's labor-intensive. But in a low-volume B2B context, it's one of the highest-leverage activities a marketer can do. Because what you're building isn't a statistical model — you're building an intuition about your buyer that no dashboard can give you.
The phone call as a research method
Here's the approach that consistently delivers more insight than any analytics tool: calling converted clients and asking them simple questions.
Not a formal research interview with a 40-question methodology. Just a 15-20 minute conversation with someone who bought from you, approached with genuine curiosity. What were you actually looking for when you found us? What made you decide to move forward? What almost stopped you?
I do this regularly at Valueships — and the answers are almost always surprising. Not because clients say unexpected things, but because the gap between what you assumed they cared about and what they actually cared about turns out to be significant. You find out that the case study you spent three weeks writing wasn't what convinced them — it was a single sentence in a LinkedIn post. You discover that their biggest hesitation wasn't price or timeline, it was whether you'd understand their specific industry context.
This matters particularly in pricing consulting, where the buying decision involves a lot of trust. Our clients aren't just buying an analysis — they're buying confidence that someone understands their business well enough to make recommendations they can act on. That nuance only surfaces in conversation. It never shows up in a session recording.
In a B2B business with a small client base, even five or six of these conversations per quarter builds up into a remarkably clear picture of your buyer. And the patterns that emerge from six honest conversations are often more actionable than the patterns buried in six thousand anonymous sessions.
Connecting behavioral signals to content, messaging — and pricing decisions
All of this — the heatmaps, the form analysis, the client conversations — is only valuable if it changes something. The output of behavioral and qualitative analytics shouldn't be a report that gets filed somewhere. It should be a direct input into how you write, what you publish, and how you talk about what you do.
If heatmap data shows that visitors to a key landing page consistently hover over the "who is this for" section before doing anything else, that's a signal. It means your visitors are uncertain whether your product applies to them. The fix isn't a design change — it's a messaging change. Lead with the customer type, not the feature list.
If form analysis reveals that most inbound leads describe their problem in a specific way — say, "we've grown and our pricing hasn't kept up" — that phrase belongs in your content. In your headlines. In the first sentence of your case studies. Because it's not just their language. It's everyone's.
This connection between behavioral observation and structural decisions runs deep in how we think about pricing at Valueships. One framework we use with clients is feature placement mapping — essentially asking: which features are perceived as high value, and which of those also drive high willingness to pay?
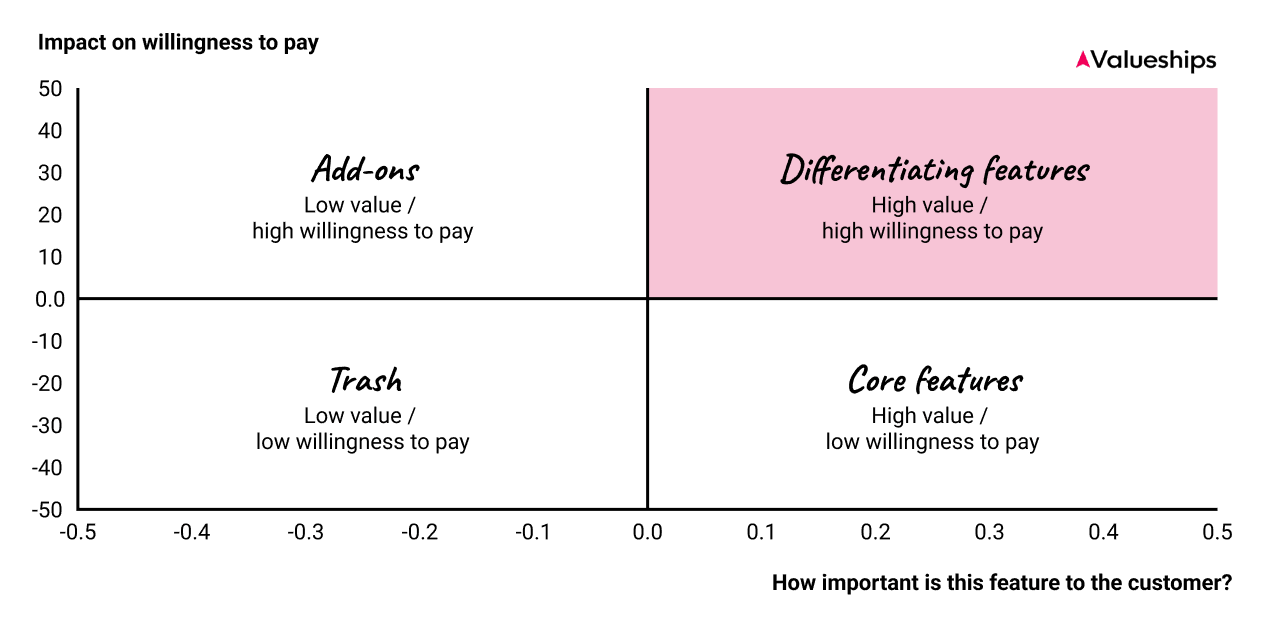
The answer to that question directly shapes packaging decisions — which features belong in which plan, and where they should be positioned on the pricing page to be visible to buyers who are actively evaluating an upgrade. But here's what most people miss: you can't answer that question from product analytics alone. You need qualitative research to understand why certain features drive willingness to pay and others don't. The behavioral signal points you to the pattern. The conversation tells you what's behind it.
Why this matters more than ever in B2B
There's a broader point here that goes beyond tactics. B2B buying behavior is genuinely complex in a way that aggregate data struggles to capture. A single deal might involve four stakeholders, three evaluation phases, and a decision timeline measured in months. The touchpoints that matter — a specific piece of content, a referral from a trusted peer, one conversation with the right person — are often invisible to standard analytics.
In this context, qualitative and behavioral research isn't a workaround for not having enough data. It's actually the right tool for the job. It captures the complexity and context that quantitative data flattens out.
When we work with clients on pricing research — whether it's a Van Westendorp Price Sensitivity Meter to identify acceptable price ranges, or buyer persona mapping to understand that different customer profiles have fundamentally different willingness to pay and value entirely different features — the most important inputs are never the aggregate numbers alone. They're the qualitative signals that explain why the numbers look the way they do. Why do 30% of users cluster at a specific price point? What are they actually comparing your product against in their head? What would make them move up a tier — or walk away entirely?
Those questions don't get answered in a dashboard. They get answered in research.
The practical toolkit
To make this concrete — behavioral and qualitative analytics in a low-volume B2B context looks like this in practice: Heatmap and session recording tools — set them up on your highest-stakes pages and review sessions regularly with genuine curiosity. Look for surprises, not confirmations. The confirmation bias trap in small-sample analytics is real: you'll find what you're looking for if you're not careful. Look for what you didn't expect.
Form response analysis — read every submission, not just to qualify the lead, but to understand the language. Track recurring phrases, problem framings, and urgency signals over time. After three months, the patterns become clear. After six months, you have a messaging brief that no agency could have written for you.
Post-conversion interviews — aim for five to eight conversations per quarter with recent clients. Ask open questions. Listen more than you talk. Take notes in their exact words, not your paraphrase of their words. Their language is your copywriting.
Behavioral segmentation by market — if you operate across multiple geographies or verticals, don't average across them. Run separate heatmaps, read forms from different segments separately, interview clients from different contexts.
The differences between markets are almost always more interesting and more actionable than the similarities. Our DACH versus Benelux finding would have been completely invisible in aggregated data.
The advantage you already have
For the B2B marketer operating in a niche market with modest traffic and a tight ICP — this is your advantage, not your limitation.
You're close enough to your buyers to actually talk to them. You're small enough that every signal matters and gets noticed. You're focused enough that patterns emerge faster than they ever could in a mass-market context.
The companies with massive datasets have their own problems — noise, averaging, analysis paralysis, insights that are statistically significant but practically meaningless. You have something they don't: the ability to go deep instead of wide. To treat every data point as a conversation rather than a coordinate.
In B2B marketing, especially in specialized, high-consideration categories like pricing strategy, the depth of your understanding of the buyer almost always matters more than the breadth of your dataset. Qualitative and behavioral analytics — done consistently, read carefully, connected directly to decisions — is how you build that depth.
Use it.
....................
Aleksandra Romańczyk is Head of Growth at Valueships. A B2B marketing professional with over 9 years of experience in growth-driven strategies, she specializes in growth marketing, account-based marketing (ABM), and buyer insights for one of Europe's leading pricing consultancies. Aleksandra is passionate about creating international pricing reports and collaborating with SaaS communities across Europe. She is skilled in developing brand communication, crafting content, and managing marketing projects — with a particular focus on reaching the right accounts with the right message at the right moment.