June 6, 2022
10 min read
What is web product analytics, and how can you use it?
Web product analytics is nothing more than getting to know your clients in detail, their motivations, and experiences in contact with your product.

Kamila Kotowska
Head of Growth at cux.io

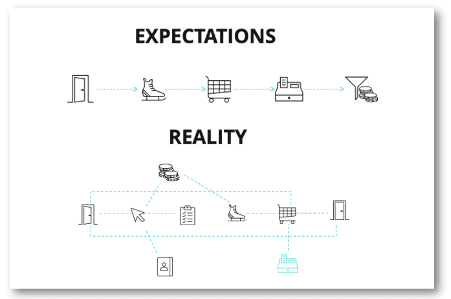
Why are we talking about the REAL customer journey? Often, when building business, we tend to idealize clients. We’re convinced that they follow every step of the path we have designed for them. Unfortunately – or maybe not — users are very chaotic in their buying habits. The paths that lead them to the conversion will therefore differ significantly. In order to understand them thoroughly, map their journey and constantly improve, you need a thorough behavioral analysis.
Why do we need product analysis?
Entrepreneurs who want to build a competitive advantage and retain and acquire customers must be ready for the ongoing digital revolution. Therefore, it will be imperative for concert activities to create a valuable digital experience for customers. Thanks to the product’s analytics, they will not have to guess user expectations. Data on their behaviors and experiences will allow not only product optimization, but also customer journey, marketing, and conversion improvements.
Product Analytics allows you to visualize and continuously analyze user engagement in real-time. This allows you to effectively build customer loyalty, improve the level of retention and increase the LTV of customers.
What to measure in new products?
New product analytics for web includes a wide range of activities and metrics. From UX, through improving user retention and engagement, to marketing messages and content. A wisely conducted product analysis allows, among others, on:
- fast identification of potential technical problems in the context of the sales funnel,
- verification of customer behavior in terms of internal organization’s metrics,
- immediate spotting of customer frustration,
- faster and wiser decision-making by verifying how much a given functionality affects customers,
- refining the appearance of pages and content presentation, in terms of what and how attracts the attention of users,
- developing categories based on user behaviors and needs,
- designing the content architecture that is optimal for users,
- recognition of places on pages, in products, and on customer journeys that generate conversion drops or have the potential to optimize sales.
4 key metrics to measure with products analytics
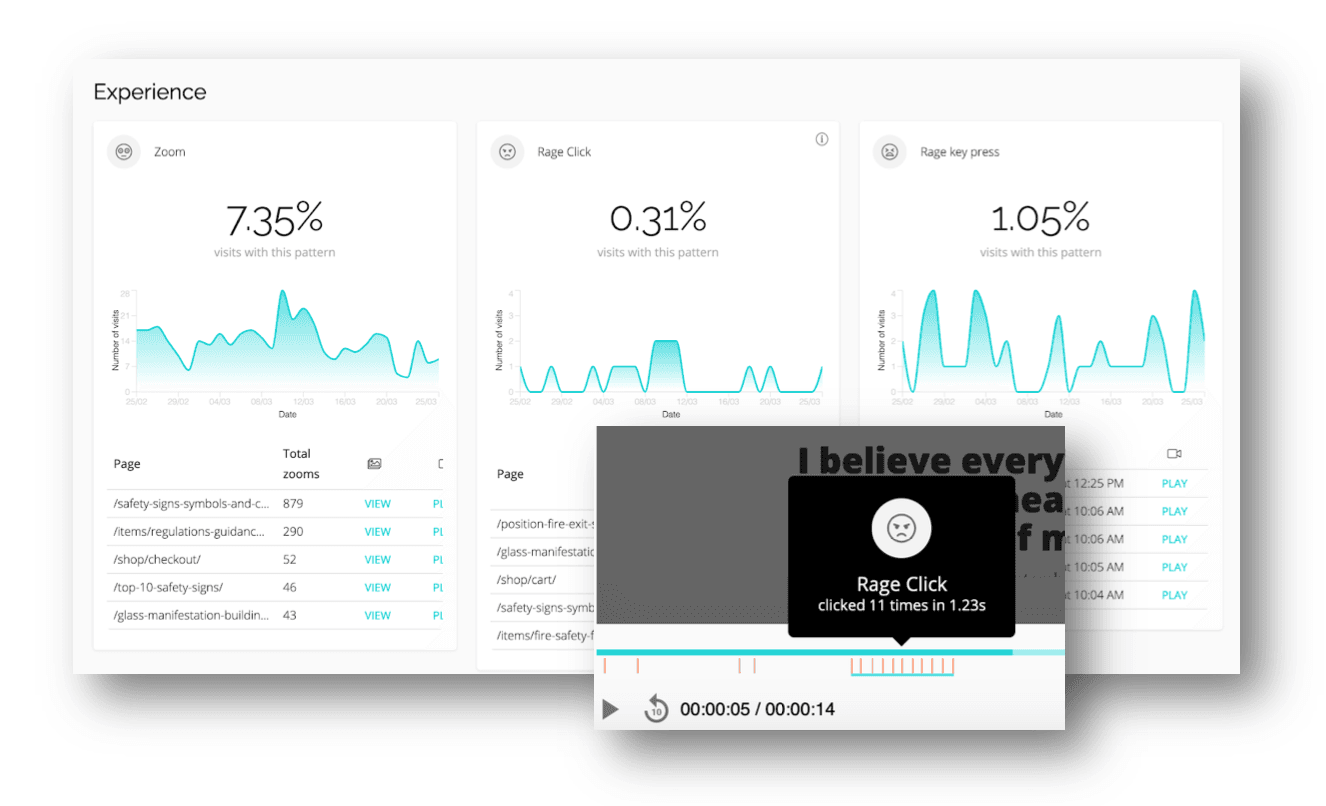
Experience Metrics
Experience Metrics contains all information about your users’ frustrations – be it compulsive page refresh, content zooming, or rage clicks. These are the situations that not only indicate the appearance of critical pain points on the customer journey. By analyzing user behavior, you’ll understand why your consumers get angry when they visit your website and how their unexpected frustration is effectively inhibiting your conversion.
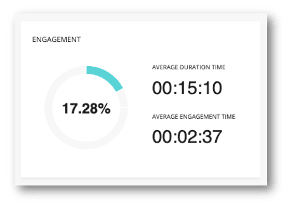
Engagement
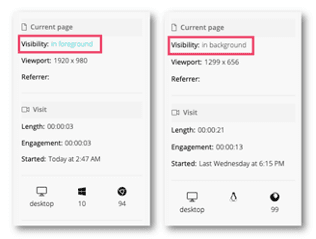
Digital product analytics is one of the most accurate ways of tracking user engagement. When are they truly active? When do they only keep your site within opened tabs? This knowledge is necessary for designing effective communication, creating ad campaigns, lead magnets, etc. Remember to always distinguish the duration of the entire visit from the actual engagement on the site!
_
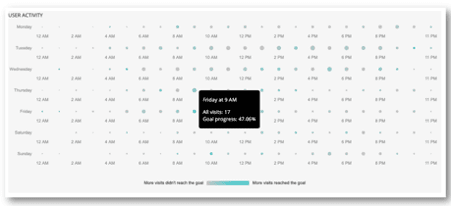
Retention
Web product analytics allows you to discover the right way to measure retention for your business model. By tracking customer behaviors and habits, you will develop an appropriate strategy to improve retention over time. You will find out when customers actually abandon their carts (maybe purchase in your store always takes place only after a few visits?). You can check at what times users actually convert. This data will help improve the quality of digital customer experiences.
Customer Lifetime Value
User Lifetime Value is the average amount of revenue that a given user brings to your business overall. This metric will help you identify which users’ segments are the most valuable for your business (See: User segmentation, or how to make your analytics effortless). Use the high-LTV customers’ journey as a templated to increase conversions, create targeted campaigns, or improve trials registration.
How to start product analytics?
1. Set your business goals.
Accurate definition and focus on specific business goals allows not only to save time devoted to analysis but also to maximize the effectiveness of optimizations. Each business may have a different end goal, e.g., purchase, form filling, file download, registration, etc.
Unlike the competition, cux.io is able to present not only a complete picture of the data – both quantitative and qualitative – but also interpret the data in relation to the business goal.
2. Find the right web product analysis tool.
There are lots of product analytics tools available on the market. Try to find the one that best suits your needs.
CUX combines qualitative and quantitative data, uses neuromarketing and behavioral analysis, allowing for quick identification of the sources of problems and matching solutions to them.
3. Map a real customer journey.
Remember that individual users have completely different experiences when interacting with your product. Therefore, when analyzing the customer journey, consider all the accompanying behaviors and emotions. Check paths for individual sources and channels.
CUX uses machine learning to detect and recognize users’ frustration points – rage clicks, rage key presses, zooming, refreshing.
4. Conduct continuous analysis.
Continuous analysis of user behavior patterns and data-driven insights can provide irrefutable arguments for making smart business decisions. Thanks to this, you’ll be able to precisely address customers’ needs and frustrations. Acting based on data – not your gut feeling — eliminates the possibility of making mistakes.
Based on expert knowledge and long-term research, cux.io is able to prepare personalized alerts explaining users’ experiences and behaviours while saving time spent on single-handed visits’ analysis.
The best product analytics tools
What are the tools of product analysis? The list goes on and on. Below you will find the most popular product analytics tools with a description of their use.
FullStory
FullStory, as a product analytics tool, lets clients watch session recordings, create funnels, and segment users. It’s a great platform for teams who care about analyzing user behavior on a website or web app, but not for teams with both web and native mobile products.
FullStory offers a 14-days free trial and two pricing plans (Enterprise and Business) available upon request.
Heap
Heap is a product analytics tool that tracks user events. Built for medium to large-sized companies, it includes features such as an event visualizer, path analysis, and conversion charts.
Heap is free to use for 1 project and up to 10k sessions/month. Paid plans offer customized pricing upon request.
Smartlook
Smartlook is a product analytics tool for websites, iOS/Android apps, and various app frameworks. It lets entrepreneurs watch recordings, use automatically tracked events, create heatmaps, and build conversion funnels.
Smartlook offers free trials and 3 pricing packages: Startup ($39.00), Business ($95.00), and Ultimate (upon request). Read more: Smartlook alternative
CUX
CUX is the first-ever UX Automation tool detecting behavioral patterns within digital products that predict which users’ behaviors may inhibit conversion. The tool automatically selects data so that entrepreneurs can immediately find their customers’ problems and increase sales.
Using other tools than CUX comes with the need to conduct feedback research and watch hundreds of recordings of visits to pick up the occurring behavioral patterns. CUX – as a hybrid combining quantitative and qualitative data – recognize behavior patterns on its own, and checks the scale of frustration and its impact on the achievement of a business goal.
CUX is available in a free trial – its only limitation is the number of collected recordings (1k). The trail contains ALL functionalities of the tool available on a paid subscription.
Subscription starts at €49 and depends on the amount of traffic on the site and the duration of data retention.
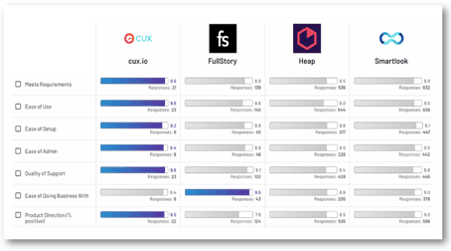
See the G2 Best Product Analytics Software at a glance
Digital Product Analytics with CUX
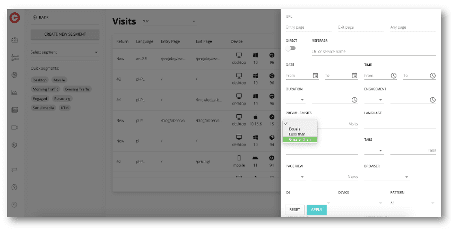
To start using CUX, you just need to implement the tracking code to the page you want to track. This can be done using the integration with Google Tag Manager or Google Analytics (toggle switch). After starting the analytics, CUX auto-captures all the events on the pages, thus not involving you in setting technical parameters.
The most important of the CUX functionalities:
- Experience Metrics. Proprietary metrics show the frustration of users on the website.
- Recordings of visits. CUX analyzes entire visits, instead of individual sessions (See: Visits or sessions? Where is the difference?). This means that it tracks the user’s visit even when he/she opens many tabs or is inactive for a long time.
- CUX generates heatmaps for single pages and SPA (single-page apps). The tool is also compatible with various types of devices – from mobiles and desktops, tablets and consoles, to smart TVs and wearables. (See: How to read a heatmap?)
- Conversion Waterfalls. CUX helps you track visitor behavior in various scenarios. In other words, Waterfall is a graphical representation of any sequence of steps visitors take on your site.
- Analysis in the context of a business goal. Regardless of what your business goal is (sales, training registration, filling out the contact form, downloading an e-book, etc.), CUX will select for you only the data about user behavior that may influence it. The number of goals for a project is unlimited.
- Auto-captures events. CUX is able to automatically pick out events on the website, allowing codeless tracking of every stage of the user’s journey without the need to involve the IT department.
- Retroactive analysis. CUX allows you to create and modify Conversion Funnel, even using historical data, without having to wait for new data to be collected.