November 5, 2025
11 min read
Find your best analytics tool: Smartlook vs CUX
Data-driven transformation is happening right now in front of our eyes. More and more entrepreneurs are learning that proper analytics will play a pivotal role in their businesses in a few months.

Aleksandra Pyza
Content Marketing Specialist at cux.io

If you are here, you probably want your organization to take part in this data-driven transformation, and you are ready to take the bull by the horns. That's great! But to do that you will need the right tool – precisely an analytics tool. Since we have met in such circumstances, right now you're probably at the crossroads, wondering which analytics tool to choose. Smartlook? Google Analytics? Hotjar? Or maybe cux.io?
In this article, we will focus mostly on one particular analytics tool, Smartlook. We will explain what it is, how it works, what are Smartlook's main features and other aspects worth knowing before you say I do. Or in this case before you add your payment card and sign up for an annual subscription plan. Shall we begin?
All you need to know about Smartlook
Smartlook is a global analytics solution tool developed in 2016. The analytics platform analyzes user behaviors on websites, mobile apps (both on iOS and Android), and in Unity Games (MobilityWare, Madfinger Games and Awesome Prototype).
Smartlook has also recently introduced Crash Reports and Page Analytics (heatmaps visible directly from recordings), expanding beyond traditional qualitative analytics.
Through qualitative data analytics Smartlook allows you to find answers to all the “whys” : why do visitors behave the way they do, why didn't customers interact with your flashy CTA, why didn’t they purchase anything, and many more. With Smartlook you will find meaningful insights and reasons behind the users’ actions.
Smartlook is a tool that can be used in various roles in organizations: product managers, UX/UI designers, marketers, developers, and of course data analysts can benefit from it. What is really important to know is that Smartlook provides integration between itself and other apps such as Google Analytics, Slack, or Salesforce.
What does Smartlook monitor?
As previously mentioned, Smartlook enables monitoring user behavior and interactions. You can track cross-device behavior across web, iOS, and Android apps with session recordings, funnels, heatmaps, events, and crash session replay. Smartlook now markets itself as a combined qualitative and quantitative analytics tool designed for fast setup and growth teams.
With those possibilities you can walk a mile in your customer's shoes and understand their emotions. But let me ask you something: doesn't it sound familiar to you? If so, you're 100% right! It resembles every other analytics tool on the market. Because if you compare Smartlook to the majority of other analytics platforms Smartlook will have almost the same features as the competition.
But make no mistake – it’s only the first impression. In every analytics tool, there are minor differences that can include pricing, reports, dashboards, self-service, or anything. So it doesn’t necessarily mean that Smartlook is not worth getting a closer look because at first glance it looks like any other analytics platform. You can find some distinguishing features in this software that can have great significance to you, your business, your organization and of course your revenue. So why not give it a shot and keep on reading?
Smartlook's main features
Just like any other data analytics platform Smartlook provides different features from which you can take insights about your users. Below you can find a list of Smartlook's main features.
Session Recordings
Imagine you can watch your customers. Know exactly what they clicked, where they tapped, or how intense their website scroll was. And to do that you don’t have to have binoculars or hide behind a curtain or shelf in a store.
Session recordings allow you to watch users' interactions and understand why customers behave the way they do. With session recordings, you can feel like an old lady from your neighborhood who knows exactly who came to your house, what you did with them and how long they stayed at your place.
Heatmaps
Another feature that Smartlook offers are heatmaps. Heatmaps are a graphic representation of customers' actions. They aggregate data in a single image that presents what elements have been clicked, how far users scroll a page, or how they move across your mobile app or between sections of your page. This visual data is excellent for spotting issues with your user interface and seeing where user attention is focused.
Smartlook offers 3 types of heatmaps:
Smartlook still offers three types of heatmaps — Click, Scroll, and Movement — and now lets teams open heatmaps directly from individual session recordings (Page Analytics).
It is worth mentioning that Smartlook offers a limited number of heatmaps that can be generated. The number depends on the subscription plan. CUX digital experience analytics platform, one of Smartlook's alternatives, provides an unlimited number of heatmaps that can be shown.
Events
Through events, you can find out how many interactions your defined event has reached. For example, you can see the number of clicks on your CTA, or see how many users have visited your MVP pages.
Smartlook removed fixed caps in public pricing materials. Event limits vary by current plan and data volume. Users manage events per project and can scale based on need. Pricing is customized above core plans.
Funnels
Last but not the least are funnels. You can compare funnels to breadcrumbs that Hansel and Gretel left to come back home. Funnels are a graphic visualization of the conversion path that you expect your customers to take in order to convert. With funnels, you can find places for drop-off and see why users decided to leave the chosen path.
Smartlook funnels use retroactive analytics, so after creating a new event-based funnel you will be able to see charts that represent your path. Just like with heatmaps, the number of funnels is very limited. On the other hand, cux.io offers an unlimited number of Conversion Waterfalls.
Who should use Smartlook?
Smartlook is an analytics solution dedicated for every business starting from sole proprietorship and ending with big enterprises like Tesco or Volvo. It’s a decent program for every kind of organization that wants to understand their user actions in-app and on pages.
Smartlook currently offers a 14-day free trial and plan levels that typically start around $55/month for web/app analytics. Exact session limits and pricing vary and are configurable for enterprise needs.
Smartlook users review
There is no better way to get familiar with the tool than reading a user review. Find out what Smartlook genuine users say about Smartlook.
Training is highly recommended before you start to use especially if your team is not familiar with heat mapping or website recording tools like Hotjar or CrazyEgg. We switch from CrazyEgg and Hotjar because of the dedicated team at SamrtLook that help onboard team members and follow-up sessions to answer questions that they might have.
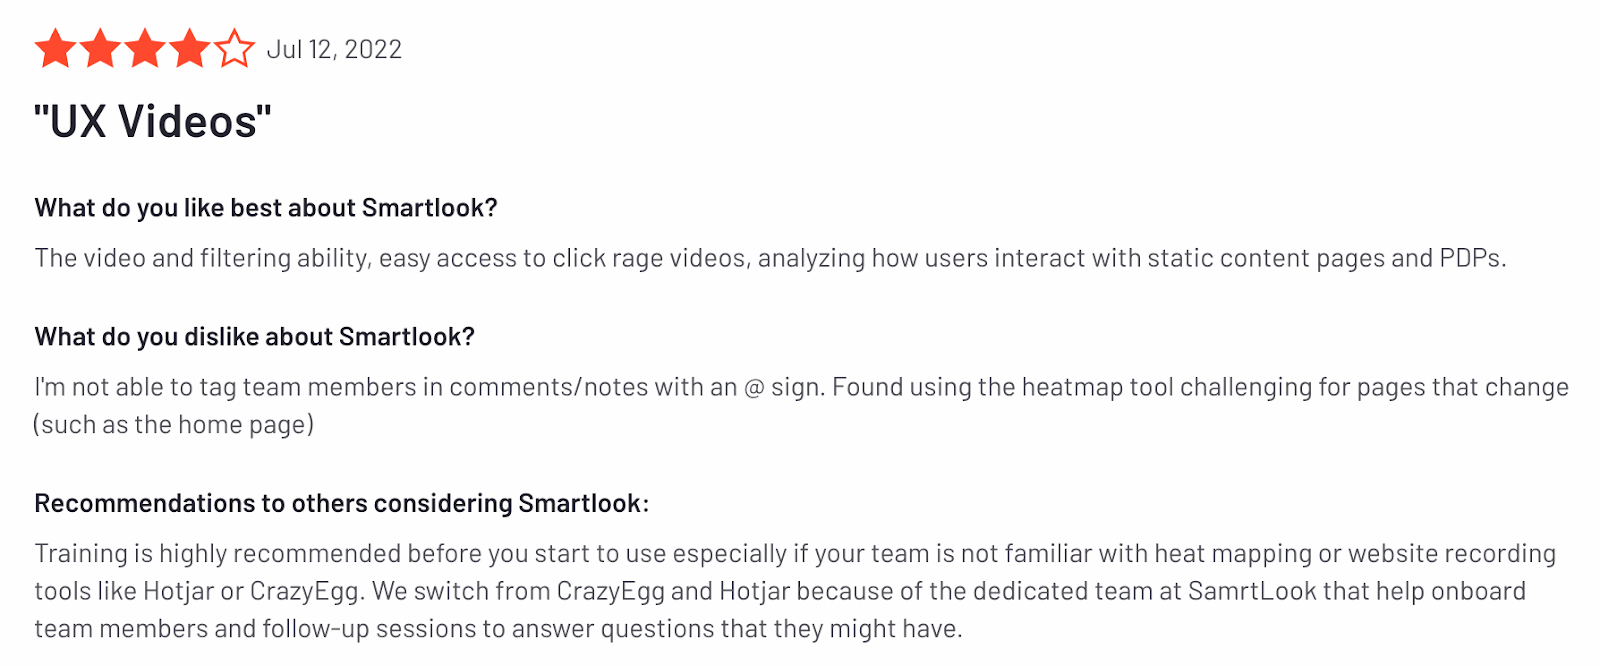
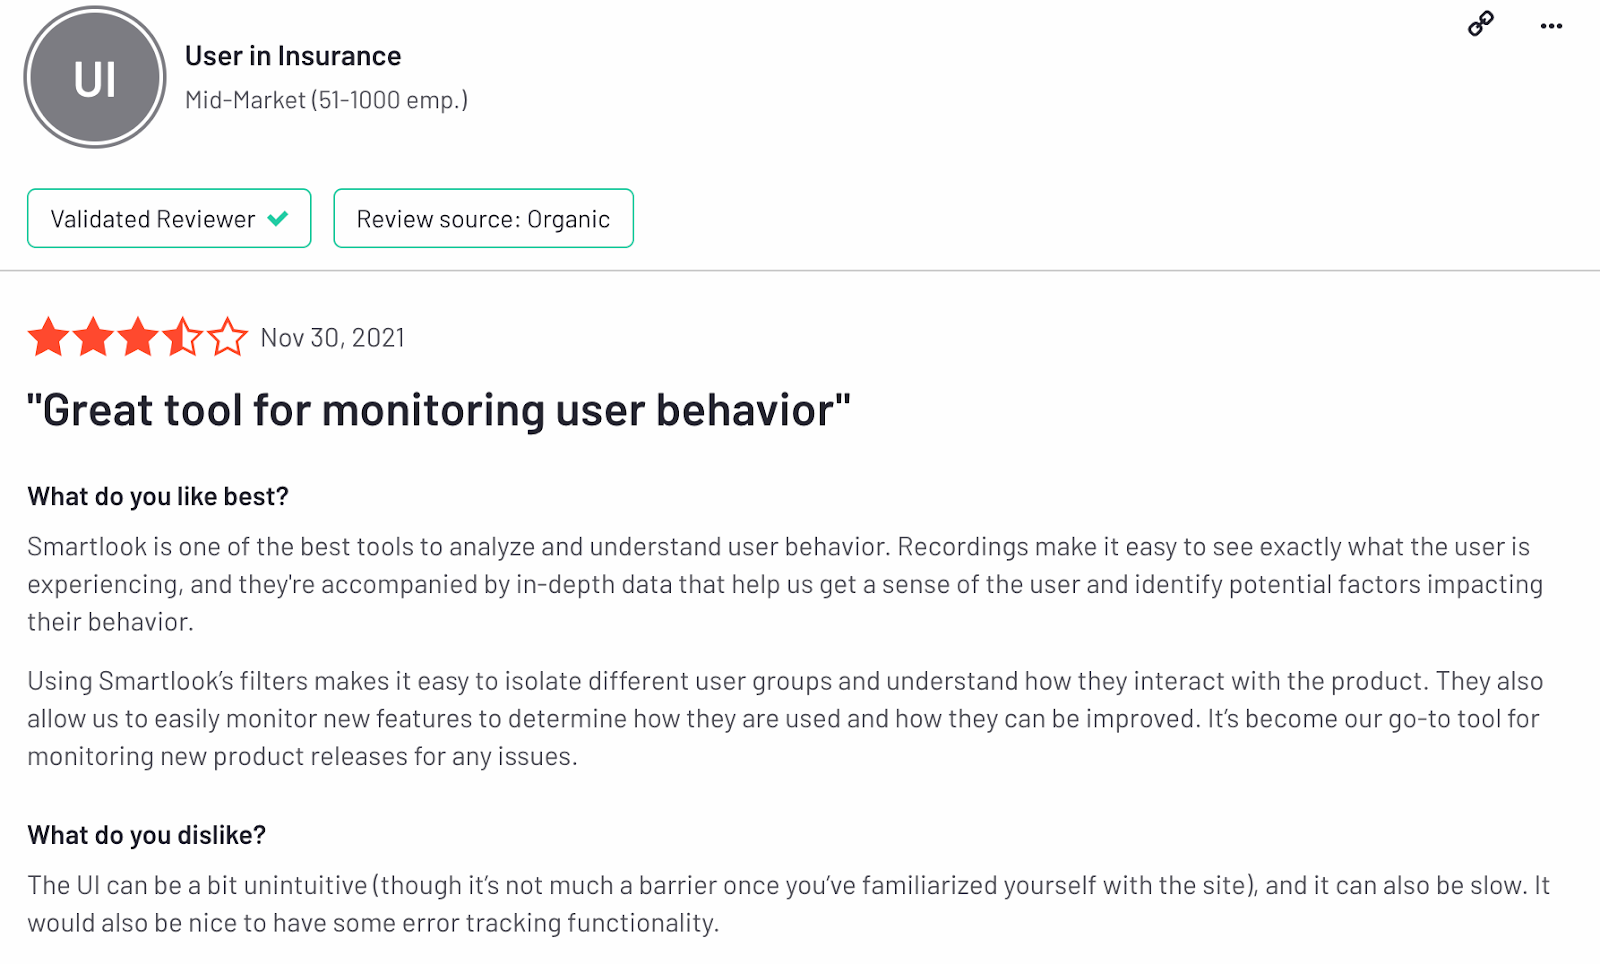
The UI can be a bit unintuitive (though it’s not much a barrier once you’ve familiarized yourself with the site), and it can also be slow. It would also be nice to have some error tracking functionality.
Smartlook alternative to consider : CUX user behavior analytics platforms
Data-driven transformation means making strategic decisions based on data analysis and interpretation. To be a part of this revolution you can’t rely only on qualitative data, but also on quantitative. Only a combination of these two will allow you to achieve the desired effect.
One of Smartlook's alternatives that efficiently combines and analyzes those two types of data insights is cux.io. CUX is a behavioral analytics platform focused on discovering revenue-killing friction in digital journeys. It analyzes full user visits (not short sessions) across web + mobile and automatically surfaces bottlenecks tied to business goals such as conversion, registration, or form completion.
You probably wonder how is it possible? Our business policy is: NO MORE DATA SPAM. To maximize the accuracy of data analytics, CUX focuses only on data that is relevant to your business goal. We automatically select data so that you can immediately identify your customers’ problems, also known as bottlenecks, increase conversions and win customers' hearts and not break them.
In 2025, CUX introduced the Insight Assistant — AI + human analysis combined. It reads heatmaps, Scroll metrics, micro-friction (rage-clicks, dead clicks, hesitation), and contextual behavior to deliver concrete insights and quick-win recommendations in seconds.
CUX can also be easily implemented by adding CUX code to your website. The code makes sure the CUX database is always up-to-date and has relevant pieces of information about visits, clicks, and all visitors' data.
Behavioral User Flows (Cross-Device Journey Analysis)
CUX automatically stitches full paths across devices — web → app → web — showing where trust is gained or lost. With the User Flow feature, you can finally follow one user’s real behavior instead of comparing separate channels. This exposes revenue-critical issues like layout mismatches, cart hesitation, or blocked micro-steps that standard analytics miss.
CUX users' reviews
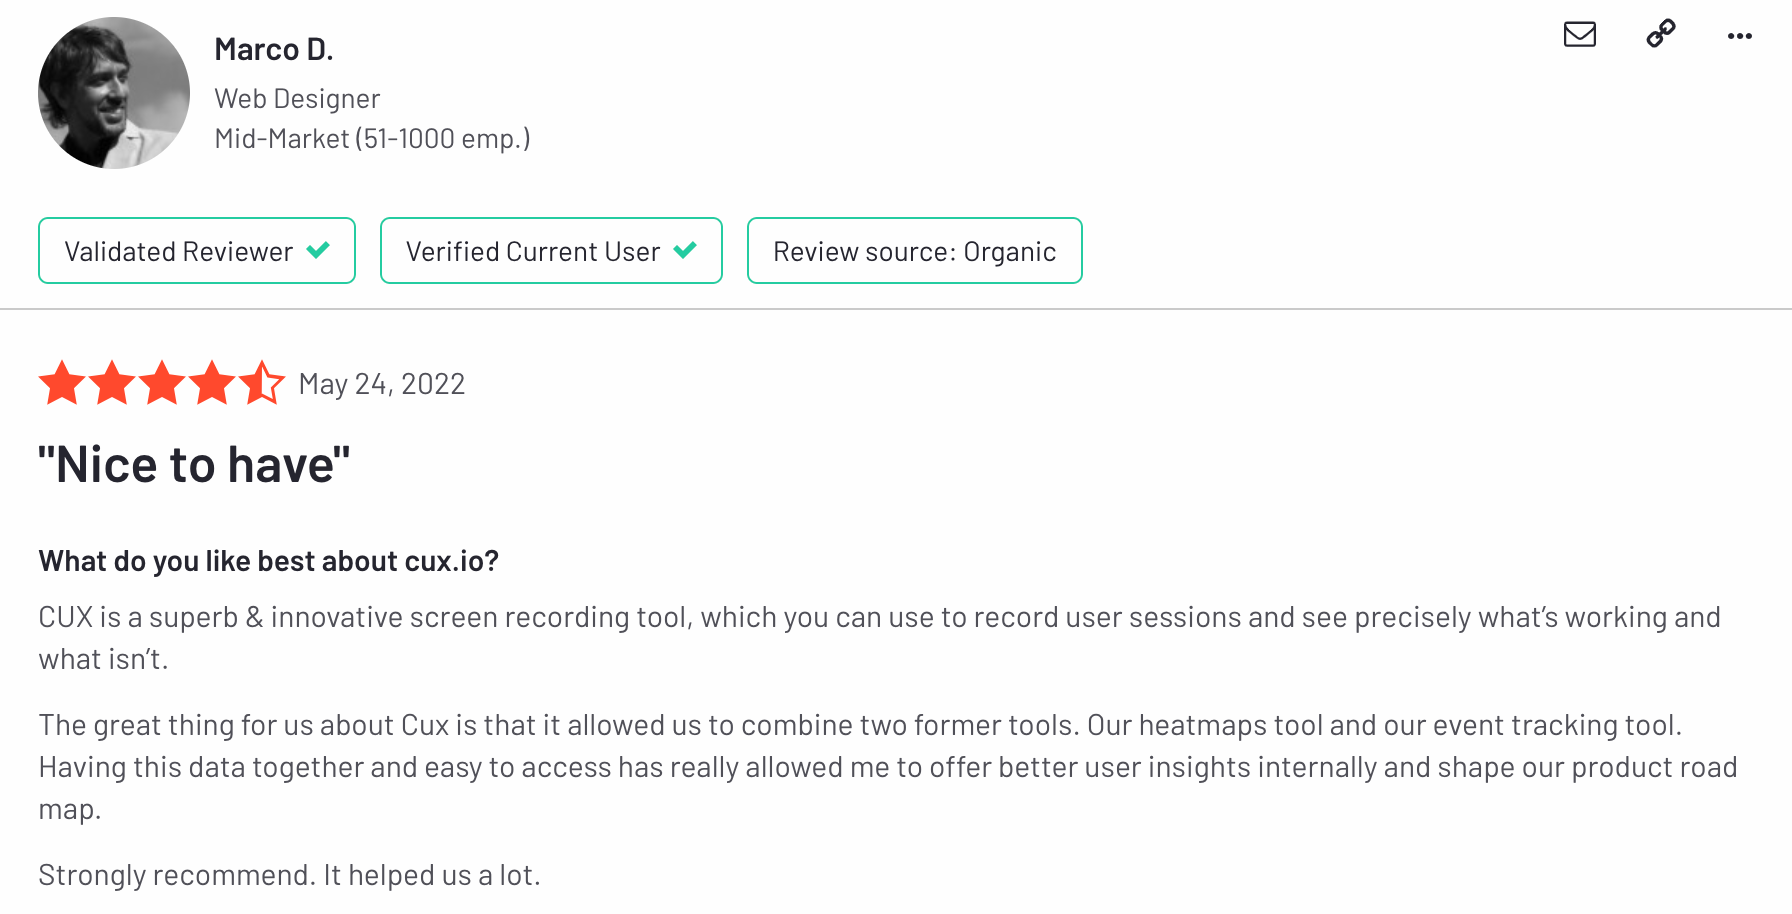
CUX is a superb & innovative screen recording tool, which you can use to record user sessions and see precisely what’s working and what isn’t.
The great thing for us about CUX is that it allowed us to combine two former tools. Our heatmaps tool and our event tracking tool. Having this data together and easy to access has really allowed me to offer better user insights internally and shape our product road map.
Strongly recommend. It helped us a lot._
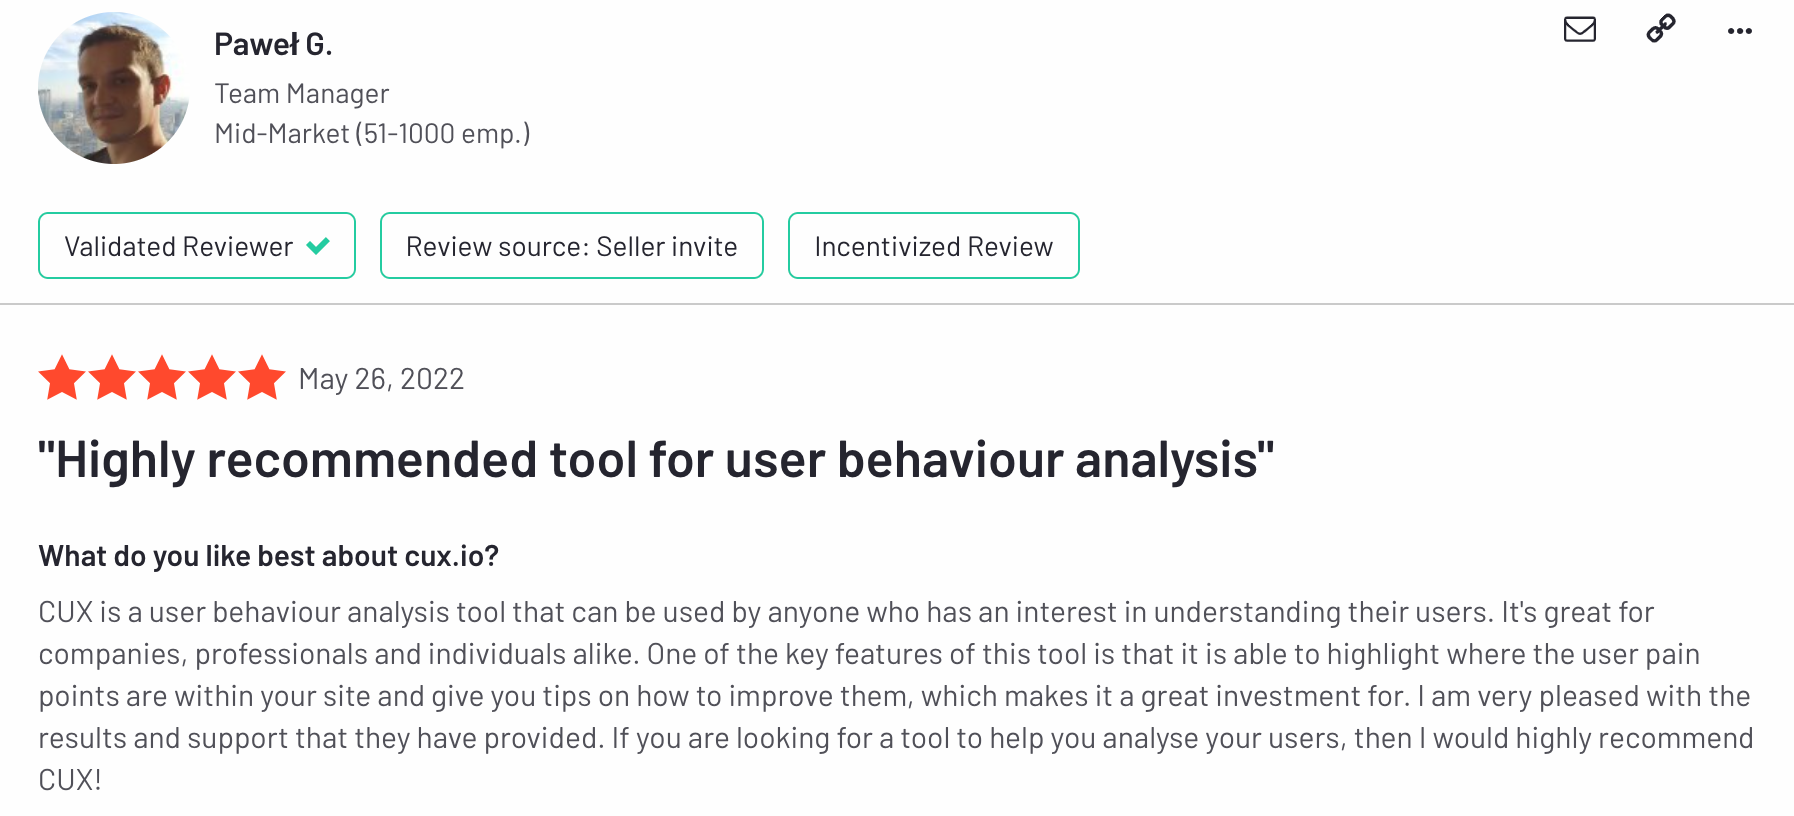
CUX is a user behaviour analysis tool that can be used by anyone who has an interest in understanding their users. It's great for companies, professionals and individuals alike. One of the key features of this tool is that it is able to highlight where the user pain points are within your site and give you tips on how to improve them, which makes it a great investment for. I am very pleased with the results and support that they have provided. If you are looking for a tool to help you analyse your users, then I would highly recommend CUX!
CUX vs Smartlook: Key differences
Accuracy of data analytics thanks to correlation to business goals
While Smartlook provides all your raw data, the CUX data analytics tool uses AI to automatically surface insights relevant to your business goals.
To ensure you make data-driven decisions and efficiently scale up your business, CUX uses artificial intelligence. Whenever you log into the CUX app you see all important Goal data on your dashboard. You can set up email notifications to be updated whenever some significant changes occur.
Visits recordings
Let’s have a quick comparison between Visits Recordings that are provided by CUX, and Sessions Recordings that other analytics platforms offer. Both features enable the analysis of user behavior on pages by watching recordings. At a first glance, it seems like those two features represent the same actions. But nothing could be further from the truth!
The difference between a visit and a session (if we take into account web analytics) is enormous. A session stands for a short fragment of the entire user’s visit to the site. Whenever the user switches a tab, checks costs, or views a different product, a new session starts. As opposed to visits which consist of many sessions.
If we want our analysis to be on point, we have to analyze the whole visit. Otherwise, we will get an inaccurate image of our customers' behavioral patterns, and believe us you don’t want that. Learn more about the differences between visits and sessions.
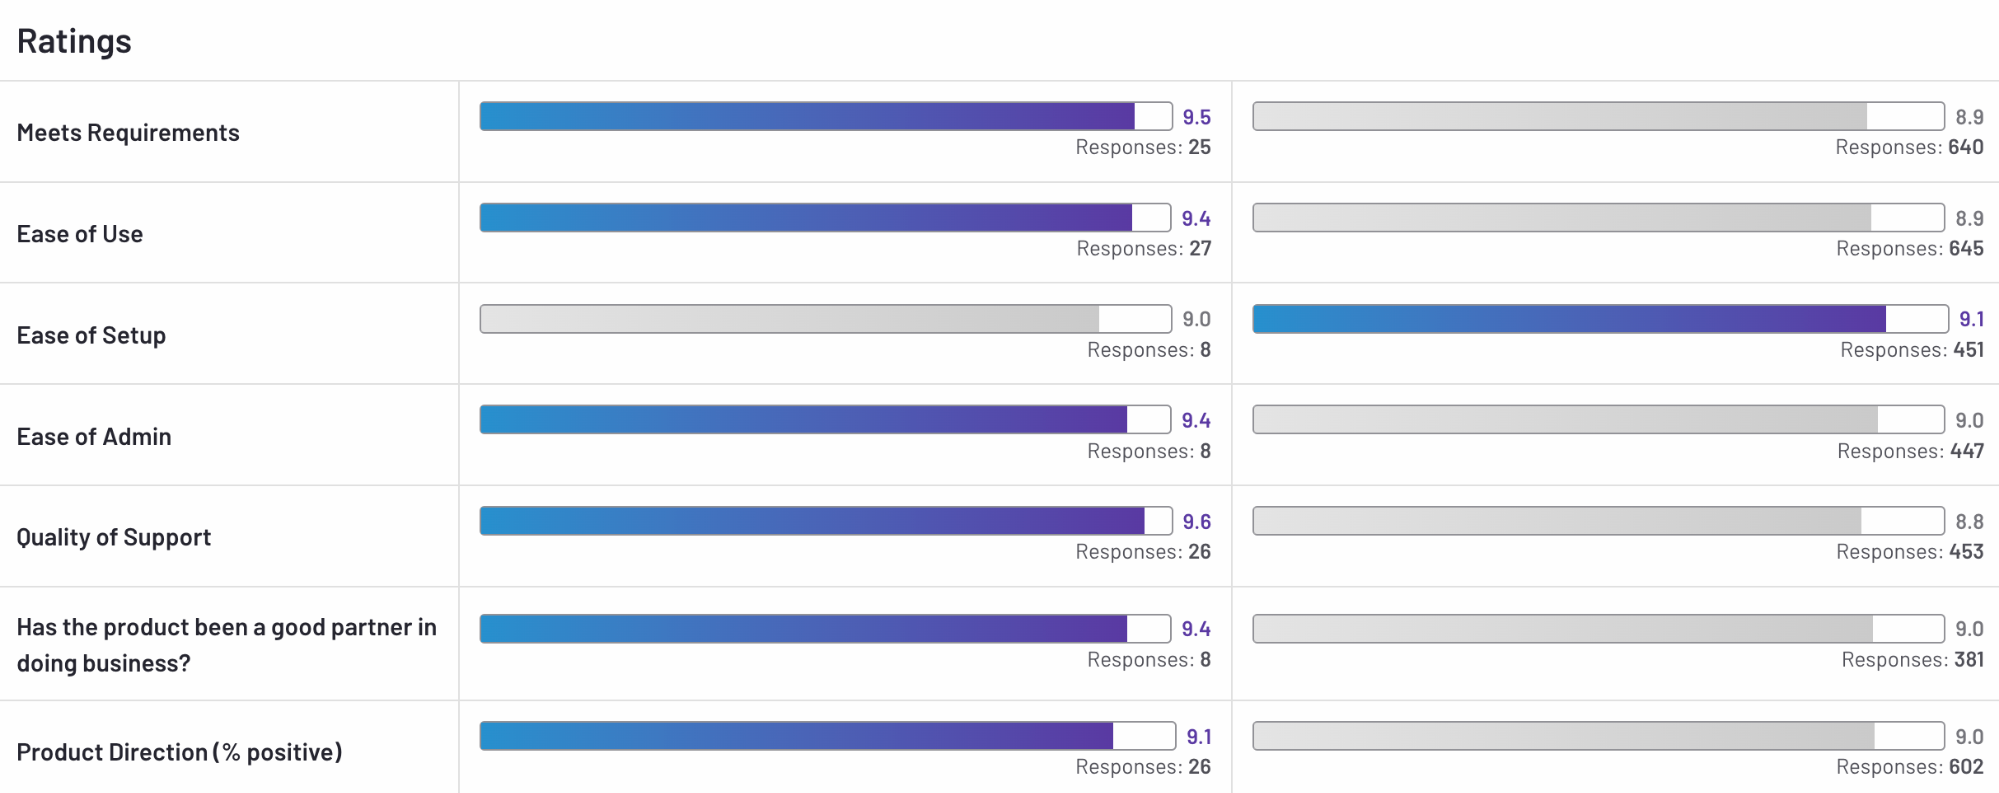
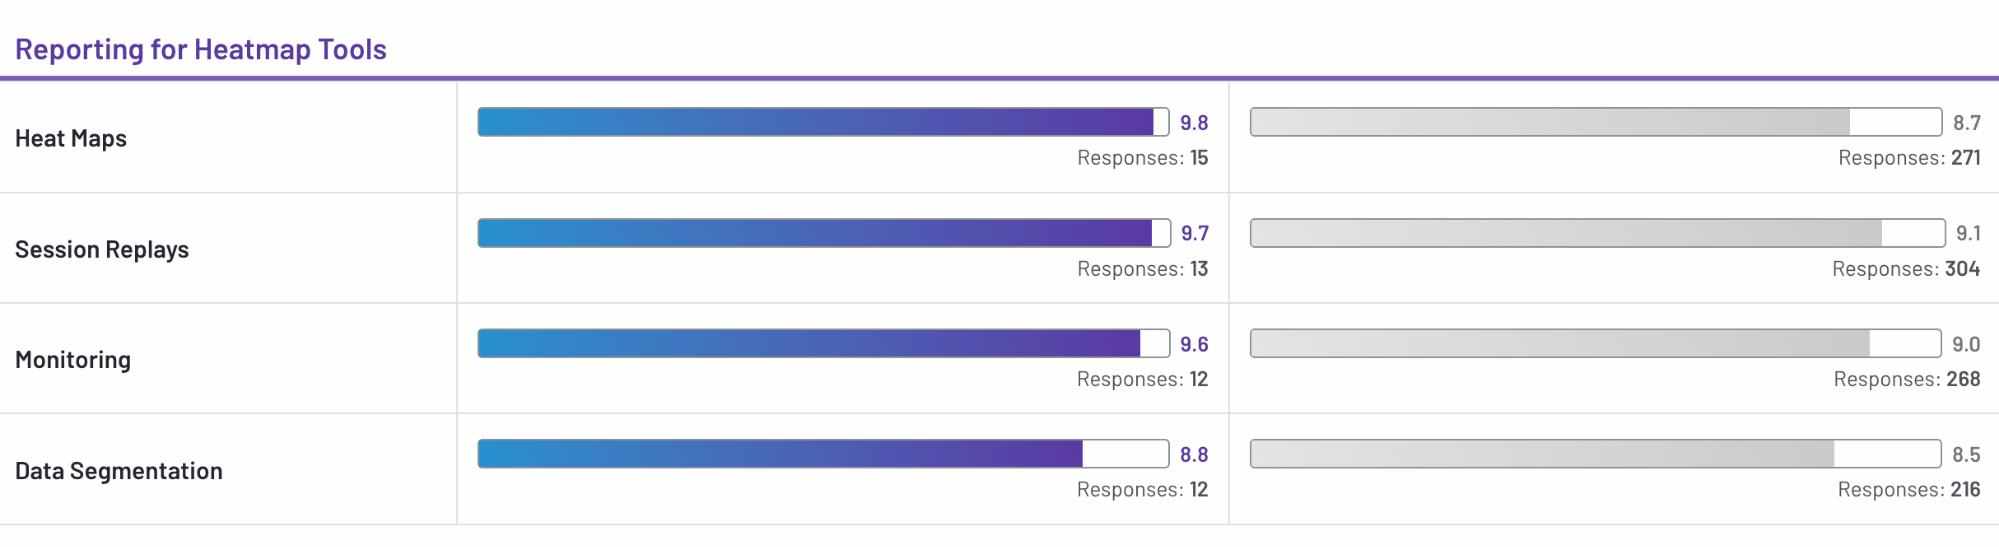
Overview from G2
Product comparison between CUX (left) and Smartlook (right). This comparison was created based on true users’ reviews.
General data analytics tools comparison from G2
Heatmap tools comparison from G2
Which data analytics tool should you choose?
As our CTO Kamil Walkowiak loves to say: “The competition doesn’t have to be worse. It’s just slightly different.” And we agree with him, 100 percent. But sometimes those details make a tremendous difference.
So take your time. If you need strong mobile analytics and traditional session replay, Smartlook is a solid choice. But if you need to quickly understand why users are struggling and want automated user frustration insights to improve your conversion path, CUX is built for you.