November 24, 2025
7 min read
Case Study: How T-Mobile fixed a conversion drop using behavioral analytics
Conversion rate – the main metric monitored by every e-commerce manager. When it grows – we celebrate, when it falls – we want to know why.

Paulina Walkowiak
Co-founder and CEO at cux.io

When standard tracking website analytics show a drop but not the cause, behavioral analytics bridges the gap. See how T-Mobile used visit recordings to find a pricing error, fix the user flow, and recover sales overnight.
TL;DR – Key Takeaways:
The Problem: T-Mobile saw a sudden drop in cart conversions despite high traffic. Quantitative data showed where (the cart) but not why.
The Diagnosis: Using CUX visit recordings, they spotted users checking the cart and leaving immediately.
The Root Cause: A technical error displayed a different price in the cart than on the landing page, destroying trust.
The Fix: Correcting the data layer error aligned the pricing, restoring the conversion path and saving the campaign.
What is conversion rate?
Conversion rate (CVR) is the number of conversions divided by the total number of visitors in a particular time period. This key metric is expressed as percentage.

Conversion Rate definition
A conversion can be anything you like that is connected to customer actions. So suit yourself! But it will be much better if your goals are business-oriented. Trust us, you don't want to waste time in search of valuable data in a sea of data spam. 😉
Conversion can refer to:
- form filling
- making a purchase
- going to the contact site
- signing up for a newsletter subscription
- scrolling
- creating free account for a trial
- clicking in CTA
Once metrics are set, the real work begins. This is the core of what is conversion rate optimization: going beyond numbers to find behavioral bottlenecks. You are ready to improve user experience and customer journey by finding pain points and bottlenecks. Discover behaviors that kill your sales.
TIP: Setting up conversion
At the stage of determining your conversion, a good practice is to ask yourself why you want to measure it. Sometimes less is more, especially if we talk about data.
Real-world CRO: Finding the "Why" behind the drop
Every marketer wants to know the secret of how to increase conversion rate or know what is a holy grail of conversion rate optimization tools. CRO combines all activities on your website, app, or other digital product to lead to a higher Conversion Rate.
It ain't as obvious as it seems, but there are several ways to optimize your conversions. Each of them is based on ANALYTICS and finding solutions that are related to your business and sales.
Remember - Quantitative tracking website analytics alone will never solve the problem—they show the drop, but not the cause. The reasons for the conversion decrease vary - just like our users. So, how can we find a tailor-made solution for our business?
Tools for diagnosis: A/B testing vs. behavioral analysis
A/B testing
Observation of users’ behavior allows us to see how visitors behave on our website and do they interact the way we want them to. If not, there is a space to run an experiment. But before you launch CRO rocket and create an A/B test, you should gather data and analyze it.
Why should we run A/B test grounded in data rather than instinct?
If something seems logical to you and obvious to run an A/B test, you should assume it is not. Okay, you have a gut feeling that this big red button on your home page with a simple sign “Sign up” doesn't work as well as it could. Sometimes the most non-logical and sometimes hideous element performs very well in contrast to other elements of your website. So you really want to change it? It’s better to focus on those elements that generate low clicks and – more importantly – influence conversion.
It is also important to determine what kind of results we expect. You need to know how what are current conversion numbers, so you will be able to compare them with the one you are testing.

TIP: A/B Testing
If you are testing several new features, make sure that at least one of them performs better than your current solution before replacing the original.
Conversion Waterfall
To diagnose a broken user flow, you need more than simple charts. CUX's Conversion Waterfall measures every conversion (click, scroll, form filling/submitting URL load) that happened on the user journey.
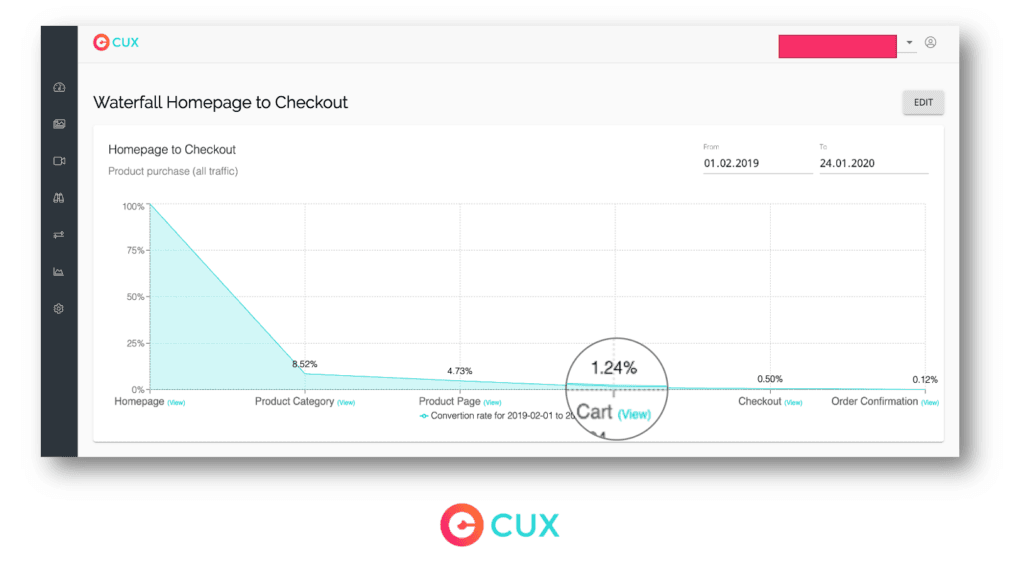
Conversion drops
Thanks to auto-capture events, you can do it by yourself, without developers' support. Additionally, for each step, you can analyze filtered visits and watch Visit Recordings for users who drop out and immediately identify their issues like broken links or specific points of user frustration.
Learn more about Conversion Waterfall – a new quality of measuring the conversion rate.
[Case study] How to boost your conversion rate using analytics?
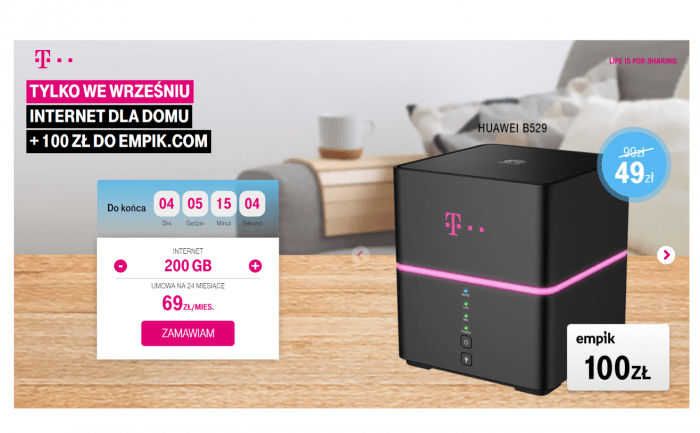
T-mobile's campaign case
T-Mobile. One of the largest mobile operators in Poland, with over 12 million customers, offering mobile and fixed services to both private customers and business clients. Sure, they owe a large portion of their success to huge marketing campaigns. But it’s analytics that gives them the advantage. Daily examination of gathered data and key indicators allows for verifying business decisions and increasing response time.
Anomaly in conversions
During one of T-Mobile’s campaigns, the level of conversion suddenly dropped. Customers eagerly moved from the landing page to the next step, but—for some reason—wouldn’t go a single step further. They were quitting the shopping cart/exiting at the shopping cart stage, causing the campaign’s level of conversion to drop drastically.
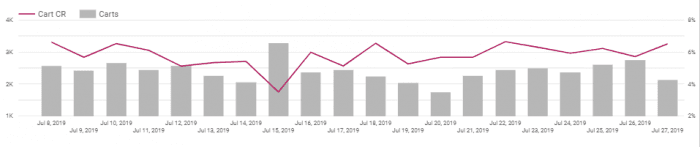
Daily routine analytics find anomalies in data
When you ask, 'Why are users leaving my cart?', standard analytics might just say 'High Exit Rate.' But in T-Mobile's case, user tracking revealed the specific answer: users were comparing the cart price to the landing page price, seeing a discrepancy, and leaving due to lost trust. No chart could show this; only observing the behavior revealed the root cause.
The situation was detected by T-Mobile employees at a daily analytical meeting. However, before any decision-making, they decided to use CUX digital experience analytics platform and go through the quitting customers’ visits – of exactly those people who added to the cart but did not convert.
Visit Recordings
Thanks to the Visit Recordings, T-Mobile easily detected the problem users were facing, and the cause of the sudden drop. They could immediately make the appropriate changes and implement quick-wins to save both, the campaign, the conversion, and the sales.
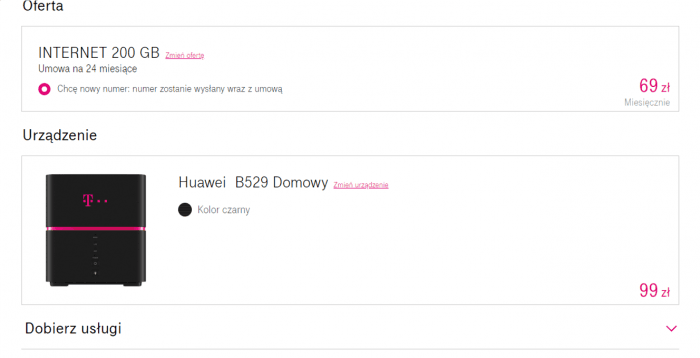
T-mobile cart view
CUX x Google Tag Manager integration
Such efficient issue detection was possible thanks to the integration of CUX with Google Tag Manager. The numbers, which are usually seen in Google Analytics, analyzed separately from the recordings, do not always quickly and clearly bring the answers.

CUX and Google Tag Manager Integration
Google Analytics wasn't enough?
Some hypotheses can be made based on Google Analytics, but GA alone does not allow you to make good business decisions with a clear conscience. Integration with Google Tag Manager brings qualitative and quantitative analysis as close together as possible. We capture all the data from the site and all the events from the data layer to cux.io, where, thanks to simple filtering by names and categories, you can search for specific recordings.
Looking at such selected events, we can define the cause of the error and – as in the case of T-Mobile – quickly make a decision to return to the desired level of conversion.
Getting a higher conversion rate with CUX
Create a free CUX account, and integrate it with GTM. See step by step how easily you can integrate Google Tag Manager with CUX on our website.