November 5, 2025
8 min read
Stop guessing your e-commerce prices. Use these 4 data types
Discover how leveraging the right datasets can supercharge your e-commerce profitability.

Maciej Wilczyński, PhD
Head of Marketing at cux.io

Successful e-commerce pricing requires four key datasets (transactional, product/margin, traffic, competitor), but the crucial fifth element is customer journey data from behavioral analytics to understand the 'why' behind your conversion rates.
Why pricing is your most powerful profit lever
In general, every business has four potential levers of profitability increase:
- You can decrease your overall variable costs, e.g., costs of unit materials or shipping costs
- You can decrease your fixed costs, e.g., move to a cheaper office, reduce headcount
- You can try to increase sales volume, e.g., open yourself to new markets
- You can increase the price, e.g., reduce discounts or increase the unit price (e.g., according to a markup calculator{do-follow})
Whatever you think of this approach, it's easier said than done. Just think about how hard it Is to sell one additional product. You must attract the customer, primarily via expensive Google or Facebook ads, ensure conversion, and service the deal.
Similarly, when it comes to costs, it takes time, may impact your effects of scale, and it's not easy to do quickly. Most likely, it will take you months rather than days or weeks. Just imagine renegotiating your rent prices with your current landlord. Or imagine the psychological toll of reducing your headcount.
Price, on the other hand, is the only marketing lever that impacts your revenue. Directly. It's visible from Day 1.
Good pricing allows you to boost your e-commerce EBITDA by +1.5% at least. However, we have seen cases of 5-10% top-line improvement.
So why do so few people try to do anything with their prices? Fear, my friend. Managers feel they might over-tweak them, impacting conversion rate, or customers will leave for the competition. That's true, but only if done in the wrong way. Bad things won't happen if you analyze suitable datasets properly. In this article, we are not focusing on the pricing strategies but only on the things that are required to even think of it correctly. Here are the datasets you need to have to play with more sophisticated pricing strategies:
- Transactional data
- SKUs, categories, and margins on every level
- Traffic, conversion, and attribution data
- Competition prices
Why are transactional datasets critical?
Intuitive, but analysis of your transactions is effectively your first touchpoint. You need to pull out the list of your transactions for the period that defaults the seasonality. Once you have this, you can start looking at the basket size, items purchased, and, most importantly, the cross/up-sell opportunities, in other words, which items bundle together and which go separately.
If you move fluently here, you can merge it with other datasets to get a bigger picture.
Transactional data are also crucial for two reasons: you can fully understand the impact of your promotional activities, the size of average discounting, and move towards any elasticities.
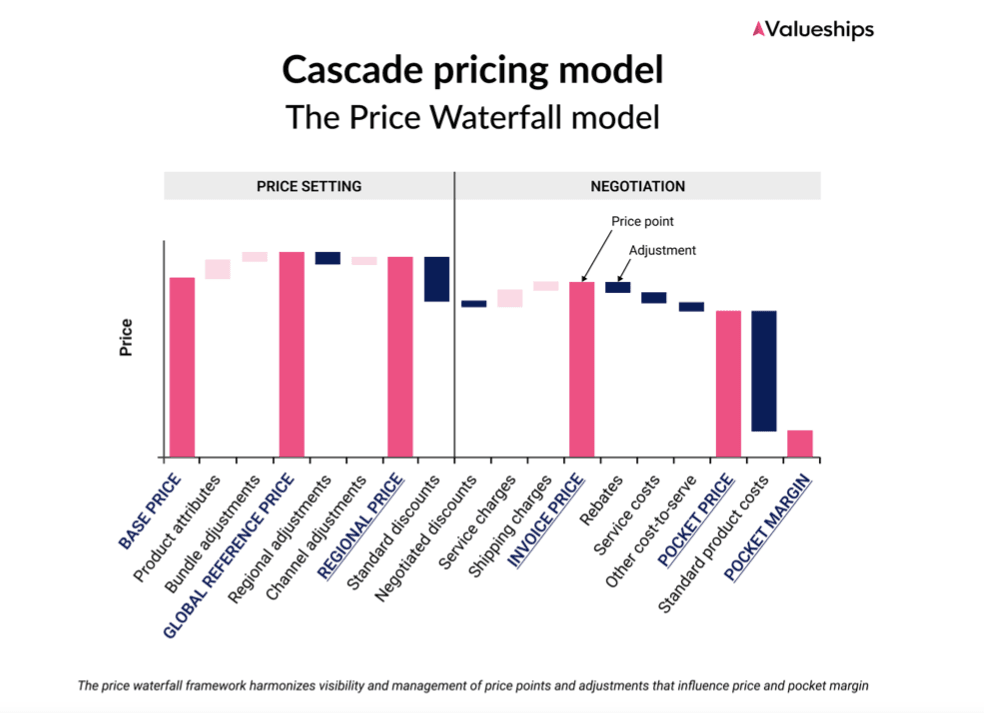
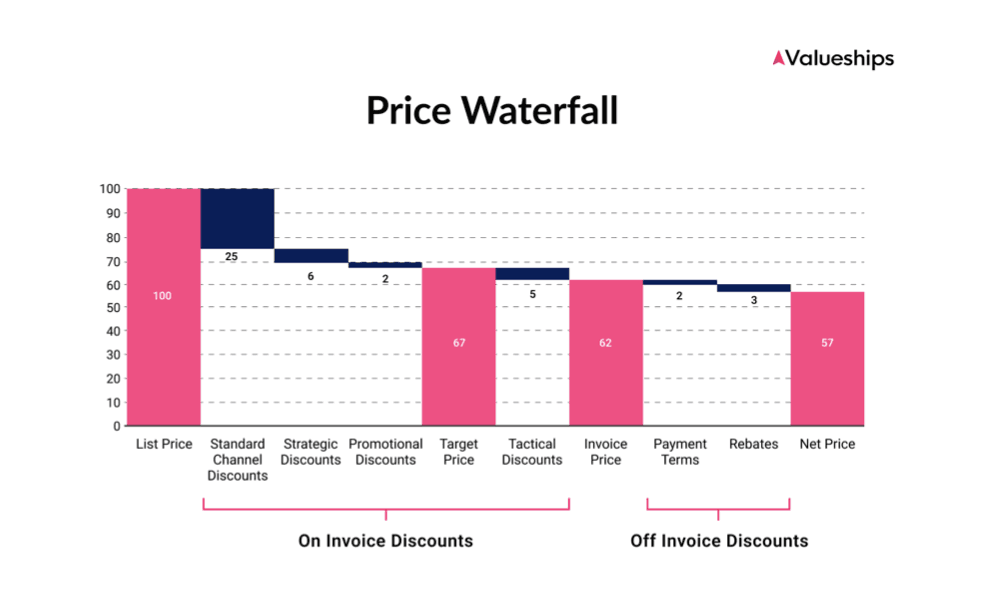
Getting into products: SKUs, categories, and margins
It's only one part of the story when you look at transactions. Another layer is to get into the user behavior segmentation details of products and categories they are in. The important part is to understand the margin waterfall and how it compounds. One thing is to sell the product at a specific price with a 70% discount, but you need to get the whole story. More or less, you should have the following waterfall logic: list price from your catalog, discounted price, deduct costs of shipping, costs of purchases, and ideally, you can blend the ads in.
Traffic & conversion data: Understanding WHAT users do
Traffic and conversion rate are the meat and bone of the e-commerce store.
You will face two challenges – first, how to blend traffic and conversion data to reduce the number of dimensions to X, Y. We suggest using something we call an inverse conversion, which is effectively an index combining how many SKU visits you need to have to get a sale. Once you have this, compare it with margins, revenue, categories growth, and everything else. This is game-changing when it comes to insights.
Secondly, you need to be able to separate the organic traffic vs. ads so you get a real view of offers' popularity. In general, the more organically popular your offer is, the more likely it is something we call a Key Value Item. KVIs are effectively responsible for your price positioning and perception. If you price highly on these items, it might affect your conversion. However, you also need to compare it with competitors.
Additional data type - behavioral data: Understanding WHY users act
Blending traffic and conversion data into an index is a powerful quantitative step. But it only tells you what happened, not why. Your "inverse conversion" index might show you need 100 visits to sell one SKU, but it can't tell you why the other 99 users left.
This is where behavioral analytics tools become critical. A digital experience analytics platform like CUX provides the qualitative context to your quantitative data, helping you break free from data silos.
Practical Example: The "Inverse Conversion" Problem
Your data shows a Key Value Item (KVI) has high traffic but a terrible "inverse conversion" index. Your data-only approach suggests lowering the price. But a user behavior analysis tool (CUX) reveals that 90% of users who drop off do so after exhibiting user frustration (like rage clicks) on the shipping calculator, which is broken on mobile devices.
The problem wasn't the price; it was a broken element on the conversion path. By fixing this simple bug, you increase conversion rate without sacrificing margin. This is the power of combining data, not just collecting it. This level of user behavior analysis is what allows you to understand the why behind your numbers.
Competitor data: Reading the market landscape
Probably the hardest to obtain, but you can't create a sophisticated B2C e-commerce strategy without it. Why does it matter? Because without that, you won't be able to differentiate which items are the most comparable with your competition and which are not. The KVIs mentioned above are these types of products. They're the ones that build the traffic, generate demand, and most likely enjoy high comparability. If you don't monitor your closest peers, then it's pretty hard to label the right SKUs.
Another challenge is how to make it happen. There are plenty of price monitoring tools, but if you have a Python expert on board, it should be pretty easy to scrape their websites with detailed product names, attributes, etc.
The tricky thing is to map them. I recommend using EANs as a comparison baseline when it's possible. If not, you probably need to be smarter and look for segmentation data among actual attributes. If that won't work, try using the categories as a starting point. Price comparisons and competitive mapping are the most challenging part of the pricing game, so be cautious.
What to do next? From data collection to strategy
First of all, getting it right will take some time, so it's good to start the process now. In the meantime, I recommend learning more about e-commerce and retail pricing strategies. Especially the approach towards KVIs, mid-range products, and long-tail items might be challenging initially. Next, I suggest getting into elasticities and cross/up-sell modeling.
If you're equipped with the knowledge and have key enablers, you can probably think of a strong profitability project directly focused on prices and promotional activities.
Whatever you decide to do, whether trying on your own or hiring external support, consider pricing and commercial aspects as often as possible. There is no faster and cheaper ROI than the investment in prices.
FAQs
Q: What's the most important dataset for starting a pricing strategy?
A: Transactional and product/margin data are the most critical starting points. You must understand what you're selling and how profitable it is. However, you can't optimize price effectively without adding traffic, competitor, and user behavior analysis data.
Q: How can I analyze competitor prices without expensive web scraping?
A: While automated monitoring software are fastest, you can start manually. Identify your top 10-15 Key Value Items (KVIs) and manually check their prices on your top 3-5 competitors' sites once a week. This provides a baseline, though it's labor-intensive.
Q: How does user frustration (behavioral data) affect my pricing strategy?
A: User frustration is a "hidden" variable. Your quantitative data might suggest a price is too high (low conversion), but behavioral analytics tools like CUX might show the real problem is a broken "Apply Discount" button or a confusing shipping form on the conversion path. Fixing the frustration (a user flow issue) often solves the conversion problem without needing to drop the price.