May 26, 2022
4 min read
Identifying and analysing high exit pages with CUX and Google Analytics
There are only a few entrepreneurs who decide to run a business without the basic numbers provided by GA.

Kamila Kotowska
Head of Growth at cux.io

Combine CUX with Google Analytics
CUX is able to integrate and exchange data with your Google Analytics account in many ways. The implementation itself is piss-easy – check it out! One of the many interesting and helpful functions is precisely identifying and analyzing pages with high exit rates.
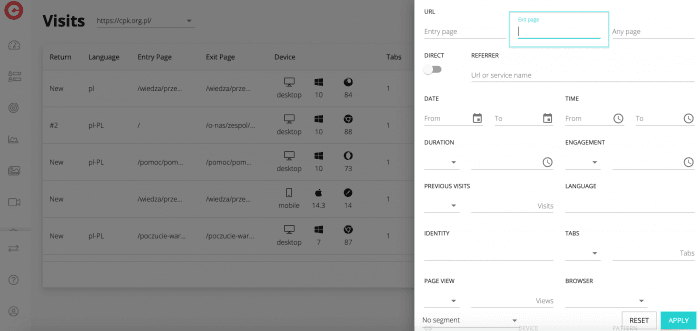
In order to that in your Google Analytics, go to Behaviour > Site Content > Exit Pages. Then sort all pages by exits rates. Make a note of – let’s say – the top 20 pages with the highest amount of people exiting. Then, in CUX, go to the visits section and use the filtering options to find recordings for each of these pages – that’s how you’ll gain access to all behavioral info behind those drops.
The common causes of high exit pages rates
-
Poor UI (mobile and desktop) Not only 88% of all users are less likely to return to a website after a bad user experience, but also mobile users are 5x more likely to abandon a site if it isn’t mobile-optimized.
-
Lack of clear CTAs A clear call to action (CTA) is essential and needs to be prominent on the page. CTAs are texts and buttons that encourage visitors to take a certain form of action – they need to get to the point and be easy to understand.
-
Low value to the visitor Content marketing methods are proved to convert 6x more often than other marketing methods – by delivering a high-value content you’re giving both your audience and business a major takeaway.
-
Type of page Remember that contact, legal and about pages often have high exit rates, as do blog posts.
-
Long loading time 1 in 4 visitors would abandon the website that takes more than 4 seconds to load, and 46% of users don’t revisit poorly performing websites.
-
Confusing page layout 52% of users say the main reason why they won’t return to a website is aesthetics.
-
Lack of contextual links Contextual backlinks – that are embedded within content – provide a good user experience by giving indication of what users can expect to see when they click a link on a webpage.
-
Lack of links to related content Google’s algorithm uses links to determine a page’s rank. 99.2% of sites that show up on the top search results have at least one external link.
-
Poorly implemented pop-ups Poorly designed and implemented pop-ups (e.g., with a too small closing, appearing on the path of a client coming from a marketplace, with an invisible closing, etc.) will only increase the frustration of users.
-
Misleading information The page content does not deliver what the meta tags and meta descriptions has promise
-
Unreadable text and small fonts 88% of users are less likely to return to a website after a bad user experience which may contain issues such as too vivid pictures, too small subtitles, wrong font (e.g., not displaying characters in a given language), etc.
-
Technical errors / blank pages Remember that you’re fighting over your customers attention with a thick competition – showing them a content they’re not interested in, or worse no content at all may push them into never returning to your page again.
-
Too many ads and distractions For example: up to 82% of users say that they have closed a page simply because of an autoplaying video ad, and 51% of them concluded that they think less of brands that use autoplaying online video ad.
Qualitative conclusions
Scan the recordings for correlation of those basic mishaps with what you see on-screen – there’s a great chance you’ll be able to detect those events immediately. Compare visitor recordings with click maps (heatmaps), and you should get a very good idea of why people are leaving your site (or your clients’ sites) on certain high exit pages pages.

Want to harvest the freshest analytical crops? Sign up for the cux.io nourishing newsletter! Be careful! We may grow on you! 🥑 😉